• Business

    Business Ideas

    ALL
    • In-Demand Businesses
    • Businesses That Never Fail
    • Best Passive Income Ideas for Increasing Cash Flow
    • Essential Tips To Start An Online Business
    • Best Websites To Buy Or Sell An Online Business For Free
    • Everything You Need to Know About Online Selling 
    • Current Business Trends: 9 Things to Keep in Mind
    • How to Open a Coffee Shop Business: A Comprehensive Guide
    • Effective Ways to Start your Business from Scratch 
    • The Main Types And Advantages Of Online Business
    Menu
    • In-Demand Businesses
    • Businesses That Never Fail
    • Best Passive Income Ideas for Increasing Cash Flow
    • Essential Tips To Start An Online Business
    • Best Websites To Buy Or Sell An Online Business For Free
    • Everything You Need to Know About Online Selling 
    • Current Business Trends: 9 Things to Keep in Mind
    • How to Open a Coffee Shop Business: A Comprehensive Guide
    • Effective Ways to Start your Business from Scratch 
    • The Main Types And Advantages Of Online Business

    Tips For A Successful Business

    ALL
    • Creative Business Proposal Ideas for Better Sales
    • Easy Digital Marketing Strategies for Small Business
    • Easy Steps to Develop Effective Time Management Skills
    • ClickUp, Trello or Hive?
    • Best SEO Tips for Small Businesses
    • Lessons Every Business Can Learn From Coworking Spaces
    • The Best Digital Marketing Strategies for a Real Estate Business
    • Useful Tips to Make Your E-Commerce Business Successful.
    • Why Do You Need to Track Your Spending
    Menu
    • Creative Business Proposal Ideas for Better Sales
    • Easy Digital Marketing Strategies for Small Business
    • Easy Steps to Develop Effective Time Management Skills
    • ClickUp, Trello or Hive?
    • Best SEO Tips for Small Businesses
    • Lessons Every Business Can Learn From Coworking Spaces
    • The Best Digital Marketing Strategies for a Real Estate Business
    • Useful Tips to Make Your E-Commerce Business Successful.
    • Why Do You Need to Track Your Spending
  • Money

    Invest Money

    ALL
    • Best Safe Investments
    • Investing In Real Estate
    • How To Invest: Are Your Investment Right Your Age
    • Best Alternative Investments
    • Best Investments To Beat Inflation
    • How To Invest In Collectibles
    Menu
    • Best Safe Investments
    • Investing In Real Estate
    • How To Invest: Are Your Investment Right Your Age
    • Best Alternative Investments
    • Best Investments To Beat Inflation
    • How To Invest In Collectibles

    Banking

    ALL
    • Best Savings Account
    • Best High Yield Savings Account
    • Best CD Rates
    • Best Money Market Accounts
    • Best Online Checking Account
    • Best Banking Apps
    Menu
    • Best Savings Account
    • Best High Yield Savings Account
    • Best CD Rates
    • Best Money Market Accounts
    • Best Online Checking Account
    • Best Banking Apps

    Loan

    ALL
    • Best Personal Loan
    • Best Low-Interest Personal Loans
    • Best Personal Loans for Bad Credit
    • Best Personal Loans for Excellent Credit
    • Best Debt Consolidation Loans
    • Best Student Loans
    Menu
    • Best Personal Loan
    • Best Low-Interest Personal Loans
    • Best Personal Loans for Bad Credit
    • Best Personal Loans for Excellent Credit
    • Best Debt Consolidation Loans
    • Best Student Loans

    Insurance

    ALL
    • Sproutt Life Insurance Reviews
    • eHealth Insurance Reviews
    • Cheap Car Insurance Reviews
    • Embrace Pet Insurance Reviews
    • Best Rideshare Insurance Reviews
    Menu
    • Sproutt Life Insurance Reviews
    • eHealth Insurance Reviews
    • Cheap Car Insurance Reviews
    • Embrace Pet Insurance Reviews
    • Best Rideshare Insurance Reviews
  • Forex

    Featured

    ALL
    • Best Forex Trading Courses
    • Best Forex Academy
    • Best Forex Trading Coaches
    • Best Forex Mentors
    Menu
    • Best Forex Trading Courses
    • Best Forex Academy
    • Best Forex Trading Coaches
    • Best Forex Mentors

    Learn To Trade Forex With Dumb Little Man

    ALL
    • Best Forex Brokers Review
    • Best Forex Trading Software
    • How To Trade Forex
    • How to Read Forex Charts
    • Best Forex Indicators
    • Best Forex Screeners
    • Best Time To Trade Forex
    • Best Forex Trading Tools
    • AvaTrade Review
    • CedarFX Review
    • Forex.com Review
    • Interactive Brokers Review
    Menu
    • Best Forex Brokers Review
    • Best Forex Trading Software
    • How To Trade Forex
    • How to Read Forex Charts
    • Best Forex Indicators
    • Best Forex Screeners
    • Best Time To Trade Forex
    • Best Forex Trading Tools
    • AvaTrade Review
    • CedarFX Review
    • Forex.com Review
    • Interactive Brokers Review
  • Stocks & Crypto

    Stocks

    ALL
    • Best Stock Brokers
    • Best Online Brokers for Stocks Under $100
    • Best Online Brokers for ETF Investing
    • Best Brokers for Mutual Funds
    • Best Online Brokers for Bonds
    • Best Blue Chip Stocks
    • Best Swing Trade Stocks
    • Stages of a Stock Market Bubble
    • Best Stock Investing and Trading Podcasts
    • Best Defensive Stocks to Invest
    Menu
    • Best Stock Brokers
    • Best Online Brokers for Stocks Under $100
    • Best Online Brokers for ETF Investing
    • Best Brokers for Mutual Funds
    • Best Online Brokers for Bonds
    • Best Blue Chip Stocks
    • Best Swing Trade Stocks
    • Stages of a Stock Market Bubble
    • Best Stock Investing and Trading Podcasts
    • Best Defensive Stocks to Invest

    Cryptocurrency

    ALL
    • Best Cryptocurrency Trading Courses
    • Best Cryptocurrency Brokers
    • Best Cryptocurrency Exchanges
    • Best Cryptocurrency Apps
    • Learn about Cryptocurrency
    • How To Earn Cryptocurrency
    • How to Trade Cryptocurrency
    • Best Cryptocurrencies
    • Best Crypto Trading Bots
    • Best Crypto Portfolio Trackers
    Menu
    • Best Cryptocurrency Trading Courses
    • Best Cryptocurrency Brokers
    • Best Cryptocurrency Exchanges
    • Best Cryptocurrency Apps
    • Learn about Cryptocurrency
    • How To Earn Cryptocurrency
    • How to Trade Cryptocurrency
    • Best Cryptocurrencies
    • Best Crypto Trading Bots
    • Best Crypto Portfolio Trackers
  • Health

    Health Conditions

    ALL
    • Macular Degeneration
    • Testosterone
    • Constipation
    • Hormonal Imbalance
    • Stomach Bloating
    • Sleeping Problems
    • Baldness
    • Lower Back Pain
    • Toenail Fungus
    • Mouth Sores
    • Eye Dark Circles
    • Stomach Bloating
    • Headaches
    • Face Acne
    Menu
    • Macular Degeneration
    • Testosterone
    • Constipation
    • Hormonal Imbalance
    • Stomach Bloating
    • Sleeping Problems
    • Baldness
    • Lower Back Pain
    • Toenail Fungus
    • Mouth Sores
    • Eye Dark Circles
    • Stomach Bloating
    • Headaches
    • Face Acne

    Product Reviews

    ALL
    • Diet & Weightloss
    • Exercise and Fitness
    • Beauty and Skin
    • Hair and Nails
    • Strength Training
    • Yoga
    • Dietary Supplements
    • Over-40 Supplements
    • Sexual Health
    • Dental Health
    • Men’s Health
    • Women’s Health
    • Sleep and Dreams
    • Best Weight loss Supplements
    • Best Fat Burner Supplements
    • Best Hair Growth Supplements
    • Best Vision Supplements
    • Best Memory Supplements
    • Best Natural Testosterone Supplements
    Menu
    • Diet & Weightloss
    • Exercise and Fitness
    • Beauty and Skin
    • Hair and Nails
    • Strength Training
    • Yoga
    • Dietary Supplements
    • Over-40 Supplements
    • Sexual Health
    • Dental Health
    • Men’s Health
    • Women’s Health
    • Sleep and Dreams
    • Best Weight loss Supplements
    • Best Fat Burner Supplements
    • Best Hair Growth Supplements
    • Best Vision Supplements
    • Best Memory Supplements
    • Best Natural Testosterone Supplements
  • Relationship

    Blogs and Tips

    ALL
    • Females in Relationship
    • Men in Relationship
    • Dating Tips
    • Finding yourself
    • Marriage Tips
    • Love
    Menu
    • Females in Relationship
    • Men in Relationship
    • Dating Tips
    • Finding yourself
    • Marriage Tips
    • Love

    Dating Guides

    ALL
    • Best Catholic Dating Sites and Apps
    • Best Christian Dating Sites
    • Best Pagan Dating Sites and Apps
    • Best Teen Dating Sites and Apps
    • Best Dating Apps for College Students
    • Asian Dating Guide
    • Japanese Dating Guide
    • Filipina Dating Guide
    • Indian Dating Guide
    • Black Dating Guide
    • Russian Dating Guide
    • Best Free Trucker Dating Sites and Apps
    • Best Dating Sites and Apps for Marriage
    • Best Free Crossdresser Dating Sites and Apps
    • Best German Dating Sites
    Menu
    • Best Catholic Dating Sites and Apps
    • Best Christian Dating Sites
    • Best Pagan Dating Sites and Apps
    • Best Teen Dating Sites and Apps
    • Best Dating Apps for College Students
    • Asian Dating Guide
    • Japanese Dating Guide
    • Filipina Dating Guide
    • Indian Dating Guide
    • Black Dating Guide
    • Russian Dating Guide
    • Best Free Trucker Dating Sites and Apps
    • Best Dating Sites and Apps for Marriage
    • Best Free Crossdresser Dating Sites and Apps
    • Best German Dating Sites
  • Trading School

How To Trade With Point and Figure Chart – An Expert’s Take 2023

Written and Published by Wilbert S on January 4, 2023 - Reviewed by Dumb Little Man

 How To Trade With Point and Figure Chart – An Expert’s Take 2023
Money Stocks
by Wilbert S January 4, 2023

Whether a day trader or swing trader, you know the importance of finding and trading with the trend. Point and figure charts are one of the best ways to identify the long-term trends in the market. Besides that, it is also a basic tool for technical analysis.

But why are points and figure charts important? Well, the traditional charts only show the price action. But, point and figure charts are best for visual representation that indicates the changes in supply and demand. Investors can utilize charts to produce a map of the price and make predictions about its path, assisting them in formulating trading tactics.

To better understand the point and figure chart, we have got Ezekiel Chew, the founder, and CEO of Asia Forex Mentor. Ezekiel is a well-known figure in the point-and-figure charting community. With his in-depth knowledge and years of experience, he will share the ins and outs of P&F charts with us.

In this article, we will discuss the basic concepts of P&F charts, their history, usage, how to calculate Point and Figure charts, and more. So, let’s dive right into it.

Table of Contents

  • What is Point and Figure Chart
  • History of Chart Pattern
  • How to Use Point and Figure Charts
  • Point and Figure Charts – What do they Indicate  
  • How to Calculate the Charts  
  • Point and Figure Charts Advantages
  • Point and Figure Charts Disadvantages  
  • Analyzing a Point and Figure Chart  
  • Point and Figure Charts Vs. Renko Charts  
  • Best Stocks and Forex Trading Course
  • Best Stock Brokers
  • Conclusion: Point and Figure Chart
  • Point and Figure Chart FAQs

What is Point and Figure Chart

Photo: Asia Forex Mentor

Point and Figure charts are technical charting dating back to the early 1900s when it was first published in the Wall Street Journal. Point and figure have no one namesake or discoverer; rather, it is just a tool used by traders.

In earlier trading days, traders used different methods to record price action. The point and figure were created to remove the unnecessary market noise. It was designed to only show the essential price information by filtering out the smaller price movements.

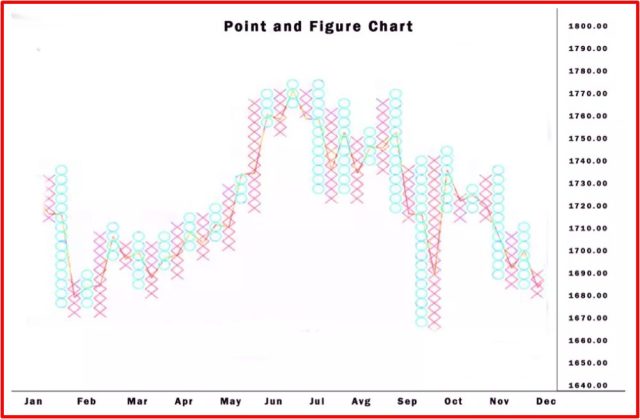
A point and figure chart look like a grid with Xs and Os. The Xs represent rising prices, while the Os represent falling prices. The chart is created by plotting these points on a graph. The main benefit of using a point and figure chart is that it only plots significant price movement. This makes it a great tool for identifying long-term trends.

History of Chart Pattern

The first references to Point & Figure charts date back to 1898, called “Figure Charts.” Over time, these charts have evolved and now feature Xs and several numbers. The basic P&F chart with X’s and O’s was created by A.W. Cohen.

P&F charts were popular among traders before computers dominated because they could easily keep track of a plethora of charts. By utilizing P&F charts, individuals with only rudimentary tools like paper and pen could analyze over fifty per day.

How to Use Point and Figure Charts

A point and figure chart’s basic purpose is to display an asset’s price volatility over a certain period. The arithmetical y-axis typically shows only amounts of money. It displays how often the prices increased or decreased and the time between each rise or fall.

The box size is the quantity used and describes the connection between y-axis markings. Moreover, the X’s and O’s on this chart represent how often the stock went up or down by a given limit. This limit is known as the box size.

Point and Figure Charts – What do they Indicate  

Photo: Asia Forex Mentor

Point-and-figure chart patterns provide information on future price movements based on past activity. In other words, investors use these charts to time their trades and maximize profits.

The interesting thing about these charts is that they don’t display a timeline. Instead, they show price swings. P&F charts are most effective when they display the price in situations where it makes a significant change. The chart will remain blank when nothing vital happens at a certain moment.

Breakouts and reversals are caused by breaking news, making bar charts and line graphs perceived as being driven by news events.

How to Calculate the Charts  

Photo: Investopedia

There is no set formula for this strategy. Yet, it does require two factors: the first is the box size, which can be a specific amount of money, a percentage of the current price, or it can be based on the actual average range and imply that box size will vary in reaction to volatility.

You will also need to adjust the amount of reversal, which is typically three times the size of the box. However, the reversal is not limited and can be customized according to the investor’s preference.

You can use high and low prices for the asset or just the closing price. If you use high and low prices, it creates extra Xs and O’s. Using only a closing price makes smaller Xs and O’s.

Point and Figure Charts Advantages

Photo: MQL5.com

P&F charts offer many benefits to traders. These charts are easy to construct and understand, yet they provide a wealth of information. Below are a few of the advantages of P&F charts:

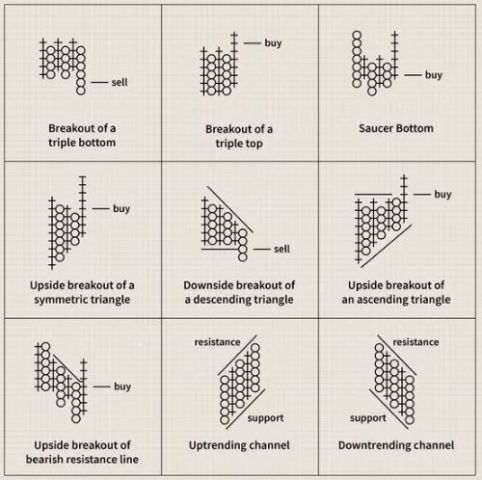
  • Breakdowns and breakouts are clear cut: Purchasing and selling signals cannot be debated. However, a signal must have supportive evidence from the chart to back it up.
  • Investor sentiment contained: Investors don’t buy or sell based on emotions but point-and-figure signals. Therefore, any news report will not deter an investor from making a transaction if there is no signal.
  • No arbitrary drawing of trend lines: The rules for drawing trend lines on P&F charts ensure compactness, keeping with other charting systems such as the bar and candle. In this case, subjective trend line placement is conceivable.
  • P&F charts are more reliable because they eliminate unnecessary data.

Point and Figure Charts Disadvantages  

Photo: Tradersdaytrading.com

Despite their many benefits, P&F charts have a few disadvantages. These include:

  • Reversal and box size scale impact signal development: By modifying a chart’s parameters, you can control whether or not a signal appears. To get accurate results that you can rely on, it’s important to use the same method and scale for every chart.
  • Don’t display gaps: Overnight gaps are not always easy to spot, making it tough for investors who trade within a day or two.
  • On point and figure charts, absences of volume are evident. Regarding value, volume is highly valued by investors and technical analysts. However, because these graphs ignore volume, investors must consult other sources to complete their analysis.

Analyzing a Point and Figure Chart  

Photo: Investopedia

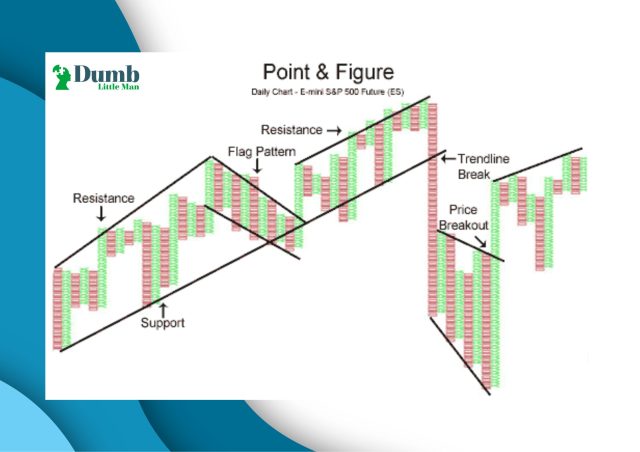
P&F chart traders can use indicators such as supports, resistance, and moving averages, among other patterns, to study the movements of a given chart.

When reading a Point & Figure chart, investors should look for four basic indicators: trend lines, support, and resistance levels. By doing this correctly, you can increase your chances of investment success.

Support levels are more easily discernible on P&F charts. Investors and traders can create a line connecting the lows of an arrangement of O’s with shared bottoms. Moreover, they can draw a horizontal Resistance line at the peak of X-Columns that have sequential equal highs.

Point and Figure Charts Vs. Renko Charts  

Photo: Renkotraders.com

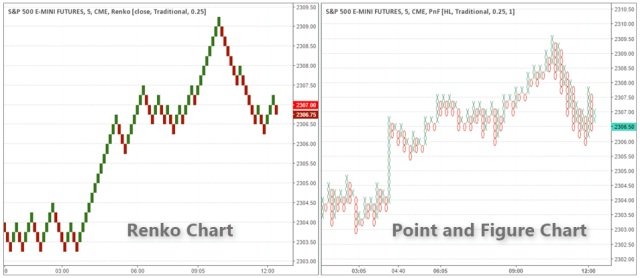
Renko charts are based on box size. They form an up or down brick if the price moves by the box size, and these bricks go to the previous brick. However, Renko chart bricks cannot be close to one another. A reversal happens when the price goes opposite by two box amounts.

The look is the main distinction among the chart kinds. For example, P&F charts are made up of side-by-side columns of X’s and O’s, whereas Renko charts are formed from boxes placed out one after another.

Best Stocks and Forex Trading Course

Ezekiel Chew's Biography
Photo: asiaforexmentor.com

Ezekiel Chew is a professional forex trader, coach, and founder of Asia Forex Mentor. With over a decade of trading experience, he has helped many people achieve financial freedom through forex trading.

Ezekiel is one of the most seasoned traders and makes 6-figures per trade. His trading methods are backed by mathematical probability. He has trained many people from all walks of life, including bankers and traders from institutions.

The Asia Forex Mentor program is a complete forex trading course covering everything from beginner to advanced. The course is designed to help people achieve financial freedom through forex trading. It includes all the essential information a trader needs to know to succeed.

So, if you are looking for a comprehensive forex trading course taught by a professional trader with years of experience, then the Asia Forex Mentor program is a great choice.

RECOMMENDED TRADING COURSE

REVIEW

VISIT

Asia Forex Mentor Resize v3

#1 Forex, Crypto and Stocks trading course. Ranked most comprehensive by Investopedia and Best by Benzinga. Free to Try!

12345

Best Stock Brokers

BrokerBest ForMore Details

Advanced Traders
Read Review


securely through Tradestation website

Intuitive Platforms
Read Review


securely through Tradier website
Best Brokers for Options

Powerful Services at a Low Cost
Read Review


securely through Tradezero website

Professional Forex Traders

Read Review


securely through Interactive Brokers website

Conclusion: Point and Figure Chart

Point and figure charts are easy to select prominent buy/sell and entry/exit points without factoring in time. As a result, these charts visualize price movements and trends well. The price series in a logarithmic price chart is the same as those observed on other charts, except that these are presented without considering time.

Point and figure charts are great for analyzing trends because most small counter-trend movements are filtered out. However, traders need to observe the current asset price to minimize potential losses when using P&F charts.

Traders can notice how a stock is doing with patterns on charts and use them to predict future prices. They’re easy to understand so that you can get accurate estimates of stock values. Traders should know that P&F charting is intended for long-term investors and has little value for short-term traders. Technical investors use charting to identify broad price trends and possible profit opportunities referred to as price patterns.

P&F charts can be sluggish to react to changes in the market. The box amount must be exceeded for a breakout to signal that one has occurred. This gives investors an edge because they don’t have to worry about bogus breakout signals getting them into trouble, and the price has surpassed the breakout point. As a result, few people buy into the idea that it is ineffective after the price rises.

Most P&F charts will reduce the number of false breakouts, but they will still happen. Something appears to be on the verge of breaking out, but a short time later, it begins to decline.

Point and Figure charts are a great way to keep investors interested in potential trends and filter out small counter-movements. But if there is a reversal, it can eliminate profits. P&F charts are especially useful for spotting reversals, as the reversal quantity is usually large.

Traders should keep an eye on the stock’s current price; the risk may be observed in real-time when utilizing P&F charts. Also, be aware of the box size, as it will determine how much security must move to produce a new column.

When it comes to analyzing trends and making predictions, P&F charts are a great tool. They’re easy to understand and can provide accurate estimates of stock values. However, P&F charts can be slow to react to changes in the market and may not be ideal for short-term traders.

Point and Figure Chart FAQs

Do Point and Figure Charts Work?

Point and Figure charts are perceived as a vintage approach to charting price changes, yet they are still useful and may provide strong results.

How do you create a Point and Figure Chart?

To create a Point and Figure Chart, you must determine the box size and reversal. The box size is typically a specific amount of money, a percentage of the current price, or it can be based on the average range. Moreover, it starts by finding the lowest low and highest high of the day. You will need to create a column of Xs or Os.

RECOMMENDED TRADING COURSE

REVIEW

VISIT

Asia Forex Mentor Resize v3

#1 Forex, Crypto and Stocks trading course. Ranked most comprehensive by Investopedia and Best by Benzinga. Free to Try!

12345

Like this Article? Subscribe to Our Feed!

Author: Wilbert S

Wilbert is an avid researcher and is deeply passionate about finance and health. When he's not working, he writes research and review articles by doing a thorough analysis on the products based on personal experience, user reviews and feedbacks from forums, quora, reddit, trustpilot amongst others.

  • Web
  • |
  • More Posts(489)

Share This:

  • 0
    Facebook
  • 0
    Twitter
  • 0
    Linkedin
  • 0
    Email
Previous post
Next post

MORE ABOUT STOCKS

Best Stock Brokers Review