Want to jump straight to the answer? The best forex broker for traders is Avatrade
The #1 Forex Trading Course is Asia Forex Mentor
When trading in the forex market, indicators are considered important. Several forex traders utilize these indicators daily to determine when it is appropriate to purchase or sell in the currency market. These indications are a crucial aspect of technical analysis, and every technical or fundamental analyst should be familiar with them.
Indicators are commonly employed to anticipate price movements. They are based on advanced computations that determine how a security might react in the future. The indicators help traders anticipate the changes in prices of the commodity, which helps them in reaching the trade decision.
Psychological Forex Indicators assist in identifying market participant mood and attempting to define probable price moves based on this information. The oscillators determine the trend's strength or the timing of a shift in the trend.
Every brokerage has a unique trading platform that provides access to the indicators for its account holders. Recently, Meta trader 4 and 5 have gained popularity amongst active forex traders due to the easiness of analyzing securities using the indicators. The trading platform allows indicators to be added directly to trade graphs or placed in a separate window.
Now we know as the popularity of online trading has grown, brokerages have focused on developing reliable forex indicators. However, only a handful of the technical indicators have endured the test of time and will prove to be the most valuable tools in your trading armory. Below are some of the best and most popular forex indicators for you to consider.
Best Forex Indicators: What are Forex Indicators?
Before placing transactions, forex traders evaluate numerous data to judge how the market is acting and how it is likely to progress in the future. Analyzing and calculating the data available for each share can be tedious and isn't a cup of tea for everyone. The easier alternative is the use of forex indicators. Indicators look at previous data such as currency prices, volume, and market performance to anticipate how the market will act in the future and which trends are likely to reoccur. Forex indicators help Traders make better trading decisions and perhaps earn more money as a consequence.
Traders utilize Forex indicators regularly to improve their chances of profiting on the FX market. Indicators, along with other types of data and research, can affect trading choices and serve as the foundation for Forex trading methods.
Trading forex isn't an effortless task. Currency trading involves market volatility that hinders the profit for many forex traders and can be risky if uninformed decisions are made. Nevertheless, traders utilize the finest Forex indicators to assist in anticipating how the market will act in the future and, as a result, which trades are likely to be lucrative based on the market behavior.


Examples of common technical indicators:
- Elliott Wave
- Swing sequences
- Fibonacci Extensions
- Fibonacci Retracements
- Trendlines
- Currency Correlations
- Relative Strength Index (RSI)
Where to find them?
The range of indicators available depends on your brokerage firm and account type. Although most forex trading platforms enable you to undertake basic technical analysis, Meta trader 4 and 5 are the latest platforms that provide access to a large number of essential forex indicators.
The finest Forex indicators are based on the idea that historical trends are likely to repeat themselves if comparable circumstances occur. Forex indicators seek patterns in specific market behavior rather than seeing the FX market as a random collection of events.
If a currency fell sharply following a political crisis, for example, it might have been the result of recurrent incidents of political unrest. If this is the case, Forex indicators will keep track of it and use it to anticipate whether or not the same behavior will occur again.
Traders may obtain insight into what influences currency values and the market as a whole by viewing this data and trading on their next market account appropriately.
MetaTrader platforms also include thorough instructions on using and calculating each indicator shown in its help files and accompanying website. MetaQuotes provides source code for each of the trading platform's technical indicators, which you may copy and modify to build your version of the indicator.
If you have programming abilities, you may edit the source code to build a new custom indicator, and you can include indicator calculation into scripts and expert advisors. Developing bespoke software for MetaTrader 4 or 5 may make your life as a forex trader a lot simpler, and it can even trade for you when the conditions are appropriate. MetaQuotes offers a free download of this popular trading platform and trend analysis tools.
What makes a Good Indicator?
It has never been easier to trade Forex than it is right now. Prices for financial instruments are more accessible than they have ever been. The currency market has existed for many years. Several trading indicators have developed over time to help traders analyze the market and, as a result, make consistent profits. Traders have been able to foresee what would happen next since the advent of forex indicators, allowing them to better match their strategies for profit.
In general, a good forex indicator has the following traits.
- beneficial to a wide range of traders
- deliver clear signals that are easy to see and trade on
- provides important information about the future of the market.
The usefulness of a technical trading indicator is determined by how you use it. Traders frequently employ various indicators with varying settings to improve the likelihood of a market shift. Some indicators are made for particular situations, while others are exclusively employed by derivatives traders. Nevertheless, there are few indicators that are preferred by most traders; however, their importance to each trader isn't the same.
Therefore, it's hard to identify a particular indicator as to the most beneficial.
Disadvantages of Using Indicators
There are two indicators: “lagging” indicators, such as moving averages, and “leading” indicators, such as price indexes.
Lagging indications appear after the market has turned, implying that the market has already made a significant move by the time you receive the signal to trade. As a result, you've essentially missed the boat. They are beneficial when markets are strongly surging but disastrous when markets are range-bound.
The other form of indicator is “leading” indicators, such as the RSI. They are supposed to assist traders in identifying tops and bottoms by attempting to forecast when the price will turn around. The difficulty is that they may be extremely harmful and deceptive since they generate many false signals before the market turns. As a result, they will frequently display overbought or oversold indications in a rapidly moving market. The leading indicators are more suited to trading in ranges.
Best Forex Indicators?
#1. Indicator 1: The Relative Strength Index
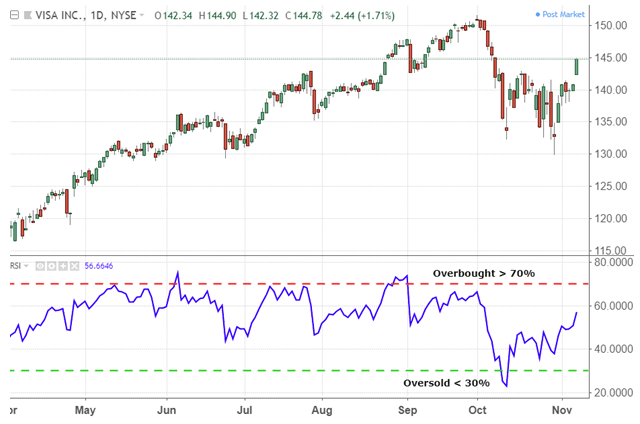
The relative strength index (RSI) is a fundamental and technical indicator that determines if a share or any other asset is overvalued or overbought by examining the extent of recent price swings. The RSI is represented as an oscillator (a line graph that travels between two extremes) with a range of 0 to 100. J. Welles Wilder Jr. created the indicator and published it in his book- “New Concepts in Technical Trading Systems.”
Since its first publication in 1978, traders have employed the RSI to gain reliable indications and make a worthwhile profit. It is amongst the top technical indicators utilized by traders, and it is included in most trading platforms.
The RSI indicator is calculated by comparing the amount of recent exchange rate gains to recent exchange rate declines for a currency pair. The RSI features a time parameter that you may adjust, although most traders choose the default 14 periods based on Wilder's choice.
According to traditional interpretation and use, range of 70 or above on the RSI signals that the asset is overbought or overpriced and may be ready for a trend reversal or corrective. A reading of 30 or less on the RSI suggests that the market is oversold or undervalued.
Like every other indicator, this too has its pros and cons. Following are the pros and cons.
Pros
- In both range and trending markets, this signal is beneficial.
- calculating price changes I've recently been more at ease with this sign.
- It's simple to use and has a great user interface.
Cons
- Because it does not follow a significant market trend, indications may arrive late.
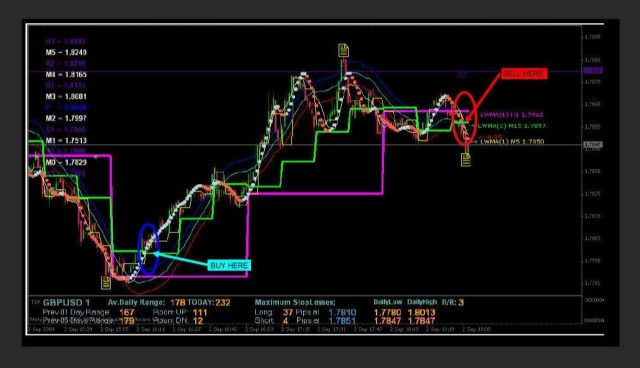
#2. Indicator 2: Moving Averages
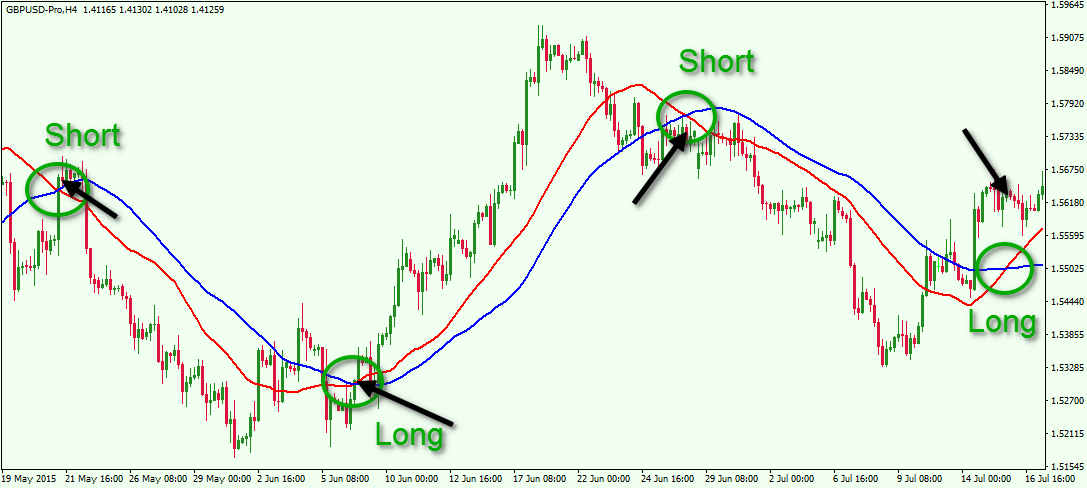
Moving averages are the most used forex trend indicators. They aid in smoothing pricing data to see broader market patterns. Moving average levels are frequently reported in the financial press and are employed by trend-following algorithms.
The Simple Moving Average (SMA) and the Exponential Moving Average (EMA) are the two most used forms of moving averages (EMA). Other types include the Weighted Moving Average (WMA) and others.
The Simple Moving Average (SMA) is calculated by averaging the prices of a certain number of bars or periods on a chart. The average price is normally calculated using the closing price, but it can also be calculated using the open, high, or low price.
The goal of calculating a stock's rolling average is to balance out price detailed information using a variety of times by maintaining a constantly updated average price.
Different moving averages may be used alone or in combination to create a solid trading strategy. The three forms of moving averages are as follows:
- Moving averages (simple)
- Exponential moving averages (EMAs): Exponential moving averages (EMA) are a cumulative total that gives a company's value in recent times more importance, enabling it a much more attentive indicator to new data. However, it is possible to change the formula to calculate from the open, high, or low.
- Smoothed moving averages (SMAs): SMA is a way of calculation that estimates the geometric average of a group of rates within a certain amount of days, including 15, 30, 100, or 200 days in history.
The pros:
- A moving average aids in swiftly determining current trend directions.
- It depicts the degrees of opposition as well as possible support.
- A moving average can also aid in the detection of trend reversals.
The cons:
- The sole disadvantage of this signal is that it is a trailing indicator that should always be used in conjunction with oscillating indicators for maximum efficiency.
#3. Indicator 3: The Stochastic Oscillator
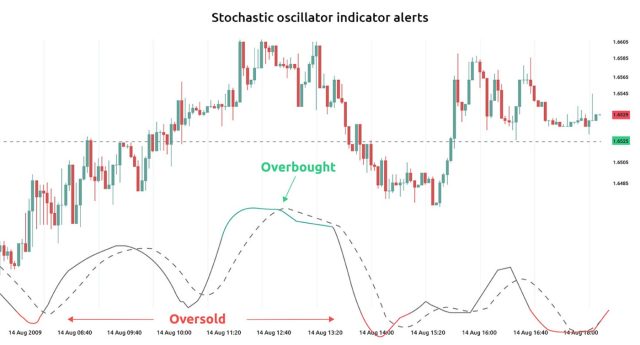
The stochastic oscillator, created by George C. Lane in the 1950s, aids traders in identifying market excesses ripe for corrections. The stochastic oscillator, like the RSI, is adjusted to a range of 0 to 100, with overbought values above 80 and oversold values below 20.
The stochastic oscillator is available in three versions: full, fast, and slow. Each features a percent Kline based on the market's proximity to the high-low range for a certain time frame, as well as a percent D signal line computed as a moving average of the percent Kline. The indicator also alerts traders about market accumulation and dispersal.
When the market closes around the stochastic high levels, it indicates purchasing pressure and accumulates it. You can reduce the oscillator by altering the time or taking a moving average of the result.
It uses a 0–100 defined range of numbers to create overbought and oversold trading signals.
To summarize it all, a stochastic oscillator is a widely used technical indicator for detecting overbought and oversold conditions.
It's a well-known momentum indicator that dates back to the 1950s. Because stochastic oscillators are based on an asset's price history, they tend to fluctuate around a mean price level.
#4. Indicator 4: Bollinger Bands
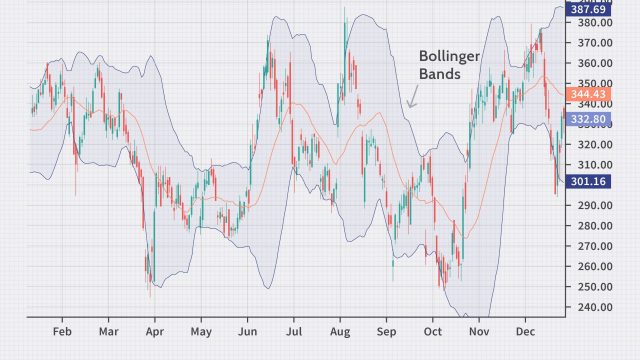
Bollinger bands are a statistical graphic that uses a formulaic approach proposed by John Bollinger in the 1980s to characterize the pricing and volatility of a financial instrument or commodity over time.
Financial traders use these charts as a systematic tool to help them make trading decisions, operate automated trading systems, and technical analysis. Bollinger Bands are a two-dimensional chart that combines a graphical band (the envelope maximum and minimum of moving averages, akin to Keltner or Donchian channels) with volatility (represented by the envelope's width).
Bollinger Bands depict the levels of various highs and lows attained by a security price throughout time and its relative strength, with highs around the upper line and lows near the lower line.
In other words, the price points around the boundaries of the established ‘envelope' can assist us in recognizing a pattern at a specific time. Depending on the volatility, the bandwidth widens and narrows.
If the volatility is great, the band will broaden; the band will narrow if the volatility is low. These bands reflect oversold and overbought circumstances about a chosen time moving average. Bollinger Bands are the same as moving average envelopes in that they are calculated differently.
The upper and lower lines in Bollinger Bands are drawn using standard deviation values, whereas the lines in Moving Average Envelopes are drawn using a set percentage.
#5. Indicator 5: The MACD
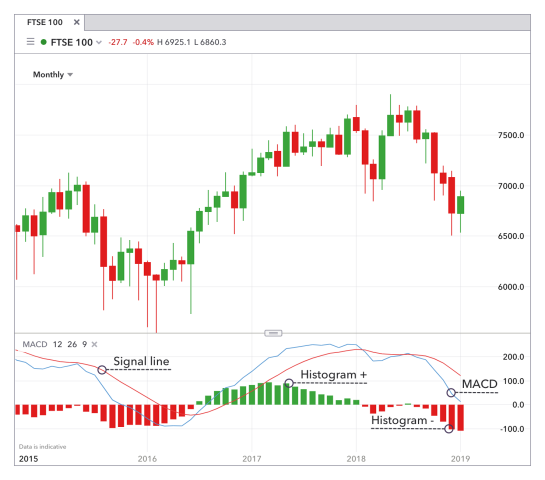
One of the most often used forex indicators is the MACD. Gerald Appel created it, one of the top forex indicators for momentum. Moving Average Divergence, or the MACD, is a technical indicator utilized in various ways.
The MACD indicator is made by taking the difference between two moving averages and plotting the average of that difference as a histogram. You may use the MACD to aid trend-following and momentum techniques by traders. The MACD line is the outcome of the computation. The “signal line,” a nine-day EMA of the MACD, is then placed on top of the MACD line, which shows itself as a trigger for buying and selling signals.
When the MACD crosses more than its signal line, traders can purchase the asset, and when the MACD crosses less than the signal line, they can sell (or short) the security.
Moving average convergence divergence (MACD) indications can be interpreted in various ways, although crossings, divergences, and quick rises/falls are the most popular.
Gerald Appel innovated the Moving Average Convergence Divergence (MACD) forex indicator to help rookie traders avoid playing on risk. It is widely regarded as one of the most efficient forex indicators.
It is unbounded and appears below the price action in most cases. It has the same time scale as the exchange rate chart. The MACD incorporates a smoothed moving average line based on the difference between two weighted moving averages.
To short it down, by subtracting the 26-period exponential moving average (EMA) from the 12-period EMA, moving average convergence divergence (MACD) is determined.
When the MACD crosses above (buy) or below (sell) its signal line, it generates technical indications. Crossover speed is often used to determine if a market is overbought or oversold. The MACD indicator tells investors if the price strengthens or weakens in a bullish or bearish trend.
Best Forex Course


If I had to recommend one course that would help you grow as a Forex trader, it would be: Asia Forex Mentor by: Ezekiel Chew
The Asia Forex Mentor by Ezekiel Chew is undoubtedly the best beginning course you can pursue if you want to know the ins and outs of the Forex market.
There are multiple blogs that would help you in understanding the program better. You can also sign up for the One Core Program that is a foreign exchange market course that teaches many forex traders how to improve their trading style and improve their trading account.
If you pursue this course with all your heart, you would learn the basics of making money on the Forex platform. Your knowledge of analyzing the market would boost tremendously, and you can seize the next opportunity to make huge profits on the market. With the right forex trading tools and this course, you will be able to prioritize return on investment over anything else.
Conclusion: Best Forex Indicators
Moving Average is one of the best forex indicators. A moving average is a useful metric used by market financial experts to determine the direction of a pattern. To arrive at an average result, it adds up the data points of financial security over a particular period and divides the total by the number of data points. Because it is constantly recalculated based on the most recent price data, it is called a “moving” average.
By analyzing the price fluctuations of an item, analysts utilize the moving average to look for support and resistance. A rolling average shows how the asset's price has moved in the past. Financial analysts then use the data to anticipate the asset's price changes.
It is regarded as a lagging indicator because it produces a signal or shows the direction of a particular trend by trailing the price movement of the underlying item.
Each level has a percentage attributed to it. The percentage represents the amount of a prior move that has been retracted. 23.6 percent, 38.2 percent, 61.8 percent, and 78.6 percent are the Fibonacci retracement levels. Fifty percent is also used, albeit it is not a Fibonacci ratio.
The indicator is valuable because you may draw it between any key price points, such as a high and a low. Between those two positions, the indicator will form levels.
If you want to trade Forex like a pro, you'll need Forex Indicators. Before choosing a forex indicator as a novice, make sure you know how it works by practicing with a demo account.
You will be able to comprehend how to apply the indicator to improve your trading skills in this manner. It only works in a market that is fluctuating. Choose the best forex indicator for better effectiveness and experience.
Best Forex Brokers
Best Forex Indicators FAQs
What is the most accurate Forex Indicator?
The Fibonacci retracement is perhaps, the most reliable forex indicator. When a price approaches a Fibonacci level, there is a good possibility that the market will respond somehow. The 61.8 percent Fibonacci retracement level, commonly known as the “golden ratio,” is the most critical Fibonacci retracement level when a reversal occurs. The Fibonacci retracement tool draws percentage retracement lines based on the Fibonacci sequence's mathematical link. These retracement levels serve as levels of support and resistance that you may utilize to set price targets.
To summarize it all, Fibonacci retracement levels link any two points that the trader considers important, usually a high and a low. The percentage levels given represent locations where the price may halt or reverse. 23.6 percent, 38.2 percent, 50 percent, 61.8 percent, and 78.6 percent are the most regularly utilized ratios. You should not depend upon these levels solely. Thus, there is a risk.
Do Indicators really work in Forex?
On the surface, indicators appear to be appealing to many new traders because there appears to be an indicator for every situation: some indicate the current trend or momentum, others tell us when the price is overbought or oversold, and so on…and they appear to provide additional guidance, adding strength to a traders toolbox.
Overcomplicating forex trading is fairly prevalent, and attempting to be too smart by adding indicators to study the markets can lead to confusion and information overload. Because there are no regulations governing forex, it's difficult to tell what we should and shouldn't utilize to aid our trading.
Which is the best indicator for MT4?
The Market Facilitation Index (BW MFI) is an MT4 Forex indicator that displays the price change for a single tick. This indicator's values are just a measure of change.
When the BW MFI grows in size and volume, it indicates that traders are opening more positions, indicating that the move has begun and will accelerate. Furthermore, this indicates that the number of dealers joining this market is growing. When this indication decreases, the volume decreases as well. As a result, traders in this market are becoming less interested.
The BW MFI might increase significantly, while the volume can decrease. This indicates that big quantities of volume from certain traders are not supporting this specific market. As a result, the price will fluctuate as traders' expectations shift.
There is a fierce struggle between bulls and bears when the BW MFI lowers but the volume grows. This is characterized by massive purchase and sell activity, with the price remaining mostly unchanged. This is because to the fact that the pressures are almost equal, resulting in a steady price at the time. This conflict will eventually be won by one of the parties. The break will usually signal whether the trend will continue or terminate.


