

Want to jump straight to the answer? The best forex broker for traders is Avatrade
The #1 Forex Trading Course is Asia Forex Mentor
Ask any experienced Forex trader about a few must-have tools for Forex trading, they would certainly mention Forex charts and for the right reasons. A Forex chart is essential for Forex trading because it allows traders to have a look at the historical behavior of a currency pair across different time periods.
Having access to the past performance of any currency pair is extremely important because it allows experienced Forex traders to get an idea of how would the currency pair perform in the near future.
How to Read Forex Charts: Forex Charts Uses and Parameters
Forex charts are used mainly by technical analysts, and they often combine these charts with different technical indicators to help them analyze and predict the performance of a currency pair much better. It is worth noting that exchange rate and previous performance indicators are the main constituents of any Forex chart. But other elements present including traded volume and open interest rate also play an important role in the development of a Forex chart.
The traded volume is one of the main parameters used by Forex traders to predict future trade volumes. On the other hand, exchange rates help a trader observe different market trends, and study the ever-changing exchange rate patterns more efficiently. Together, these two elements prove invaluable for seasoned Forex traders because they can now predict the future exchange rate, and place their bets in the upcoming period with opening and closing prices.
Most Forex chart patterns are a combination of channels, ranges, and triangles. Currency trading charts also have a “support level” parameter which is extremely beneficial because they allow a trader to find out the exchange rate level of the market, and how it will move forward in the future.
Forex Chart: Technical Analysis
Although the requirements of most Forex traders are met by these Forex charts, the case is different for analysts who analyze the Forex markets. If you are a technical analyst, or if you like to research about the Forex market in-depth, then you must be aware with the Elliot Wave Theory. For those who don't know, the Elliot Wave Theory is a theory in technical analysis that was developed by Ralph Nelson, and it is used to describe the movements of a specific currency pair in the currency market. Although it is not a must know theory, most technical analysts have an idea of how to utilize this theory when analyzing the market cycles.
Elliot Wave Theory is a crucial theory, and most technical analysts need to understand it because, according to this theory, prices will move in 5 different waves toward a particular trend. Sometimes, a triangle is created to solve the problem after completing the internal waves with opening and closing prices.
How to Read Forex Charts: Why is it important?
We have told you a lot about Forex charts in the previous section. But do you really need to learn how to Forex charts? Can you not use the information published on the internet, or watch YouTube analysis videos to help you? Yes, you can. You can be a “good” trader by reading the analysis published by other traders or websites dedicated to the Forex markets.
But are you satisfied with just being a “good trader? Don't you want to be a “great trader” or the “best trader” the Forex market has ever seen? If yes, then learning how to read Forex charts should be your first priority. It is so because currency trading charts would help you determine where should you be distributing your investments.


How to Read Forex Charts
There are no predefined strategy that can make you an expert in reading Forex Charts primarily because there are different kind of Forex charts, and each chart needs to be read differently. Although the basic steps for reading charts are the same, each Forex chart has its own parameters, and only you can decide which chart suits your needs the best.
For example, the candlestick charts patterns have a lot of potential in the forex markets and forex charting which is why many traders prefer these kinds of Forex charts. On the other hand, the trading forex chart is recommended for most beginners because it is easy to use, and it helps in identifying the price movement. The forex market has many financial instruments and different market prices. Analyzing price fluctuations is a must when reading forex charts, but you can always find the lowest traded price and a viable trading range.
It is recommended that you should give all kinds of Forex charts a try, after which you can decide which Forex chart suits your needs & requirements the best. Even if you are able to make successful investments using just one Forex trading chart, you should not get too attached to it, and continue trying different kinds of charts, and chart patterns.
This is the only solution that will be able to make you successful. You need to move on quickly to move towards success when it comes to learning how to read different types of forex charts.
How to Read the Main Types of Forex Charts
Now that we have discussed what are Forex charts, and why should you opt for Forex charts, it's time for us to discuss the main topic of this article: How to read Forex charts. Forex trading charts might seem to be difficult to read, and almost impossible to understand if you are just starting out with these charts. In such cases, we usually opt for advice from our friends & family members who have knowledge of the currency exchange market.
However, you need to always remember that just because something else is working for someone doesn't mean that it is necessarily going to work for you as well. It is the sole reason why you should start to gain knowledge of the market yourself, and make your own investment decisions after analyzing the market.
Now there are different kinds of Forex charts. Each Forex chart has its own indicators and parameters, and it needs to be read differently from the rest. We are going to tell you about the main types of currency pairs trading charts, and how should you read them.
So let's look at the steps below in which you can read the main types of trading charts if you are new in the field.
#1. Point and Figure Charts
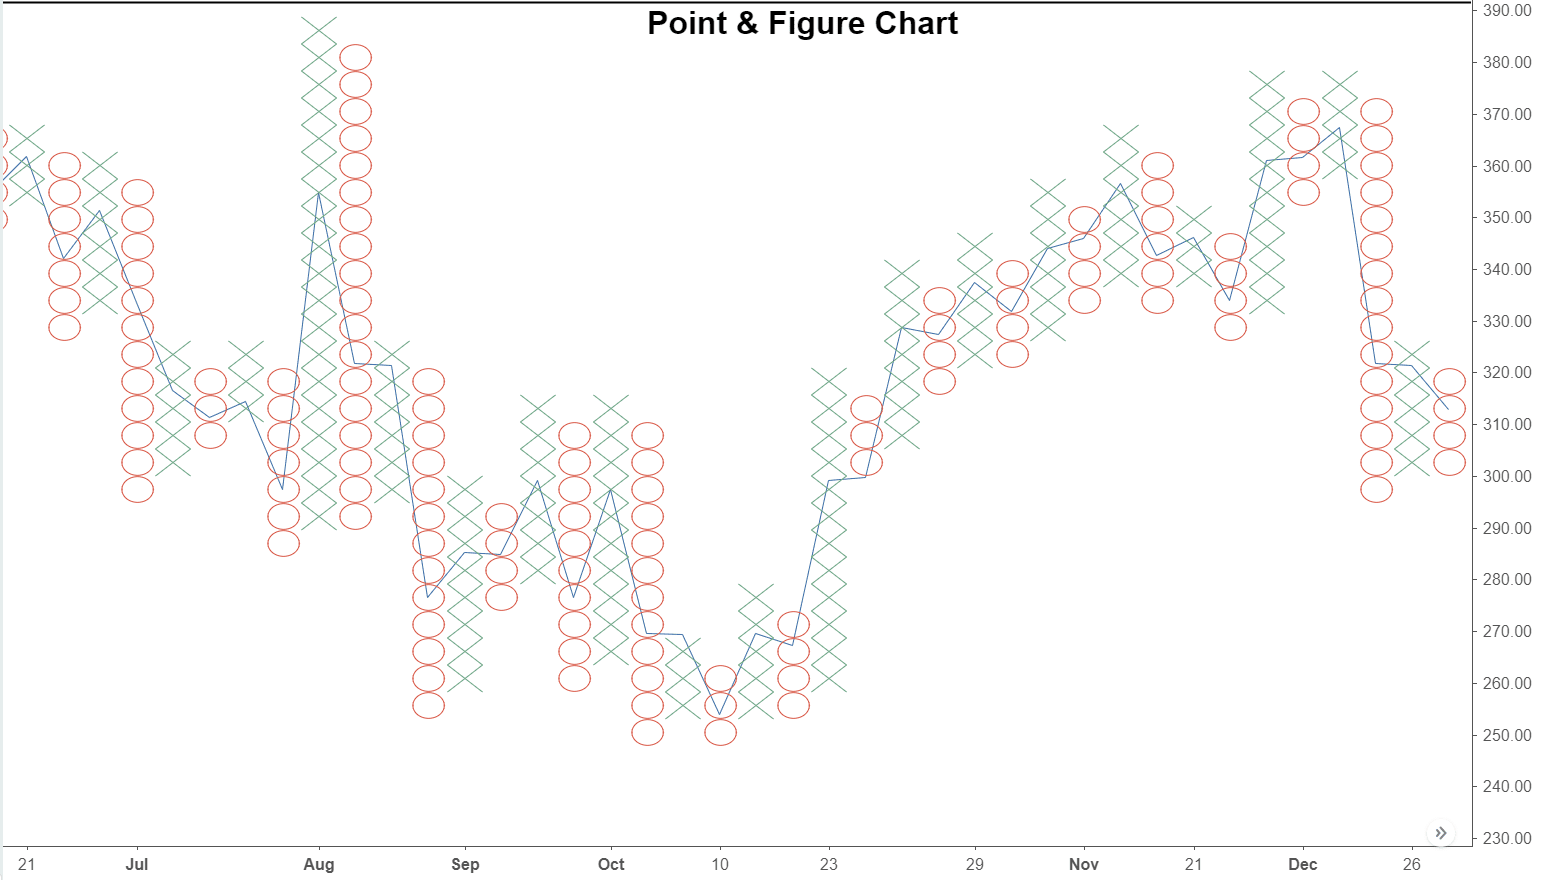
Point and figure chart is probably the most popular & most used trading chart used for Forex trading. However, the Point and Figure chart is not recommended for beginners because it isn't easy to use, which is why it is used only by professionals.
The Point and Figure chart is popular primarily because it allows experienced traders to gain valuable insights on different currency pairs. Additionally, this trading chart includes various filters that helps in filtering the exchange rate moves and identify everything.
Every box present in the chart is assigned a specific value, and the exchange rate is identified by the X and the O sign on the graph. If the price of a currency pair is on the rise, you will see at least three “X's“, which indicates that the demand of the currency pair has exceeded supply. On the contrary, when you spot at least three “O's” on the graph, it means that the supply of the currency pair exceeds its demands. The Point and Figure Chart thus shows us the trends related to a currency pair, and the supply/demand of the currency pair.
#2. Tick Charts
The tick charts have been designed in such a way they have a point drawn on them every time the market moves over; there will be a tick in the market. The major pro of using this chart is that there is no fixed time to use it, which makes it perfect for short-term traders.
Tick charts are recommended for short-term traders precisely because they will enable you to focus on the price action, and you will not have to worry about taking any action or investing it in a fixed amount of time.
#3. Bar Charts
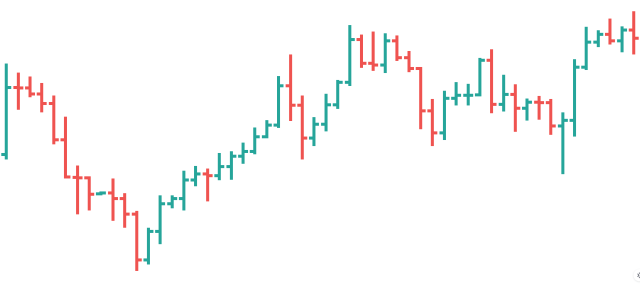
Bar charts are probably the most common and simple of all trading charts primarily because almost all of us have experience with bar charts. A bar chart is handy for those who have experience because it shows all the highs and lows for every period. It is done with the help of a vertical line and a small horizontal line. This chat also indicates closing by using a horizontal line to the left.
Bar charts often prove to be extremely useful in finding out, and identifying all the information related to Forex currency pairs. All you need to ensure is that these bars should not connected like the data points..
Reading Bar Charts
As a trader, you need to remember the following points when reading bar charts:
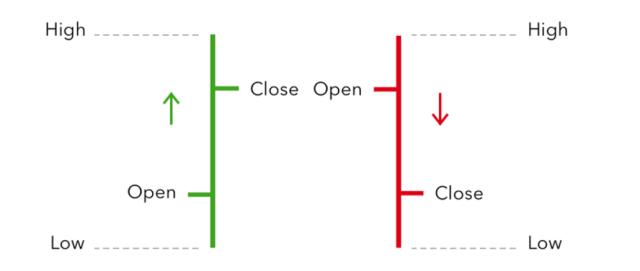
- The notch present on the left side of the vertical line represents the “Open Price” of the currency pair.
- The notch present on the right side of the vertical line represents the “Close Price” of the currency pair.
- The uppermost point on the vertical line represents the “High Price” of the currency pair.
- The bottom-most point on the vertical line represents the “Low Price” of the currency pair.
As you can see in the above figure, there are two lines: green and red. If the price of the currency pair has increased in the given time period then the vertical line would be green. On the contrary, the vertical line would be red if the price of the currency pair has dipped. The size of the vertical bar would fluctuate with the fluctuation in the price of the currency pairs.
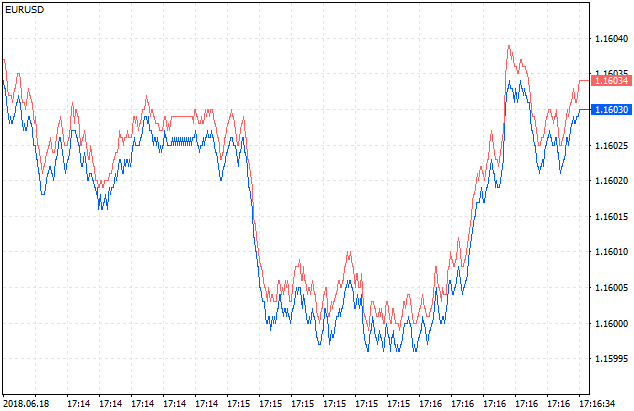
#4. Line Charts
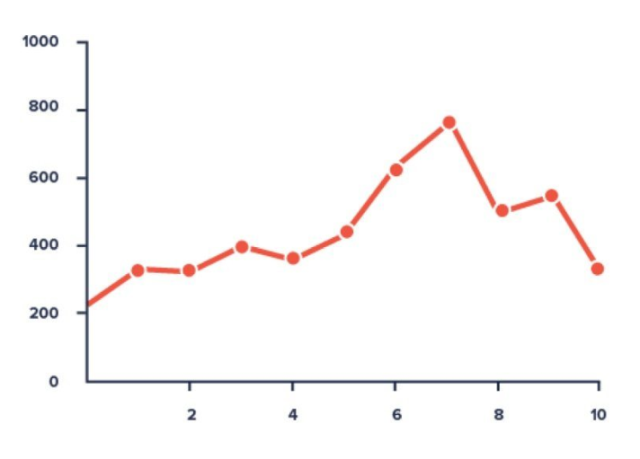
Line charts are famous because they work flawlessly, and helps a trader know everything they want to know about a single currency pair. A line chart connects a complete set of single exchange rate observations. This is done by using a straight line, and you can see what is happening over a certain period. Usually the parameters for these charts are the closing price of a currency pair. However, you can also select the opening pair, and the graph would be plotted accordingly.
If you have just started reading forex trading charts, then the Line Chart might be the perfect choice for you because it does its job well, and it is simple to understand. Additionally, line chart gives you a simplified picture of all the movements along with the exchange rate over a certain period.
The line chart might also prove to be the perfect option for you if you want to track the performance of a currency pair, and if you want to see a steep decline in the exchange rate. The best part about a line chart is that it is simple to understand, and you will not have to spend a lot of time learning how to read these line charts.
How to read Line Charts
Before you can start reading the line charts, it is necessary to determine which parameter you want to use. You can generate the line chart for a particular currency pair on the basis of the high price, low price, opening and closing prices, or an average of all these parameters.
Once the graph has been generated, you will have to see the lines plotted on the graph as whole. There would be several ups and downs as you move along the X-axis that will help you in determining the overall trends of the currency pair.
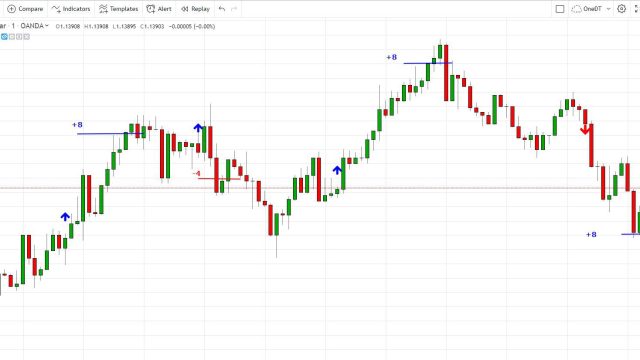
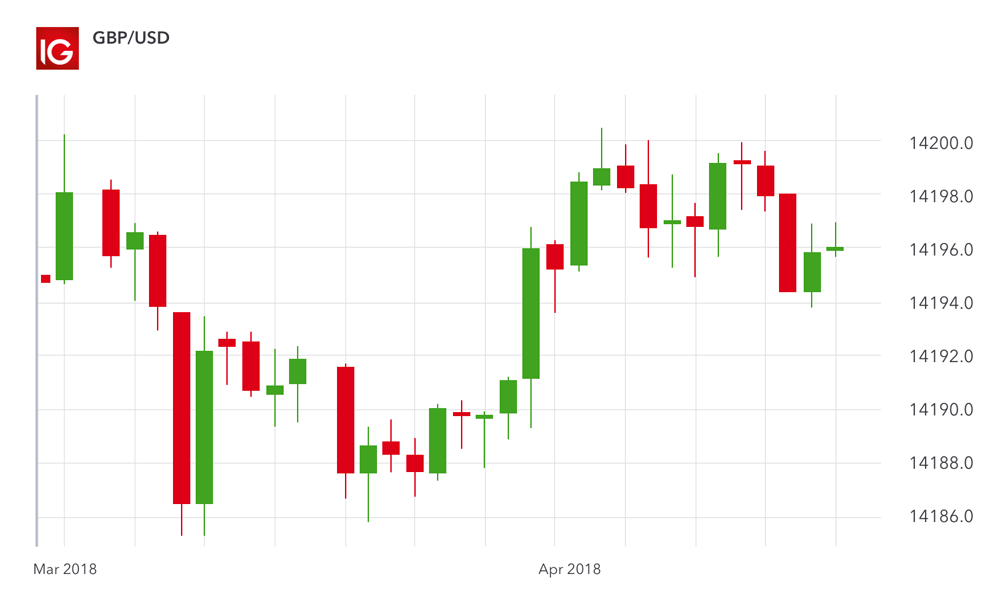
#5. Candlestick Charts
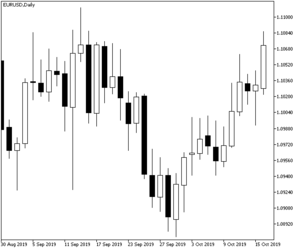
Candlestick Charts have been introduced recently, and the popularity of these charts is increasing with every passing day. Candlestick Charts have been developed by Japanese developers, and just like most other Japanese products, these charts are extremely detailed, and they pack a lot of information.
It is considered to be the most difficult chart to understand. However, once you get a hold of Candlestick Charts, you will be able to analyze the Forex market as good as anyone else. It would be safe to say that the Candlestick Charts are the encyclopedia of Forex market charts, and they give you a lot of information during a particular period.
Reading Candlestick Charts
The primary purpose of a Candlestick chart is to indicate the high to low range for a particular currency pair during a given time period. They are similar to bar charts, except they are more detailed, and much better looking.
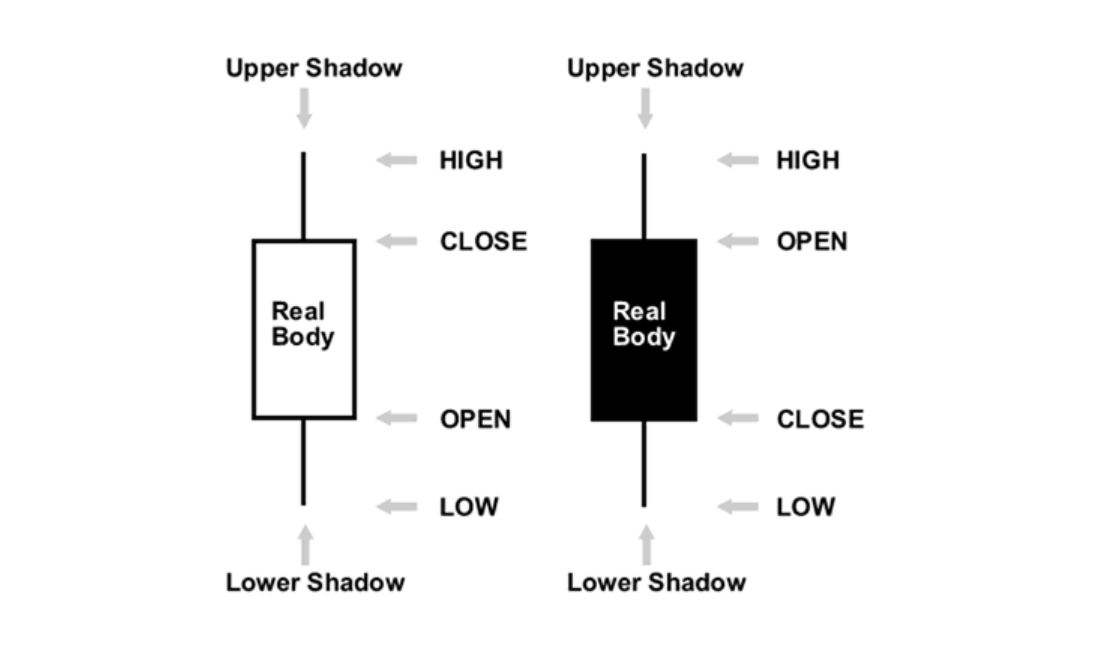
For the next step, you will have to distinguish bullish trends/candles from bearish trends/candles. On most Candlestick charts, the bearish candle is black or colored in, whereas the bullish candle is white or open. Now, you get a bullish candle when the closing price is higher than the opening price, whereas you get a bearish candle when the opening price is higher than the closing price.
Now have a look at the above figure. The left candle shows the bullish trend, whereas the right candle shows the bearish trend. The highest point at the top of the wick or the Upper Shadow point shows the highest exchange rate for the given currency pair. The lowest point at the bottom or the Lower Shadow point shows the lowest price for the given currency pair.
Best Forex Trading Course

Today, there are a lot of millionaires and billionaires who have made their fortune by investing their money in the Forex market. There have been cases where individuals have made thousands of dollars in their first-ever investment, but such cases are extremely rare. If you observe any successful Forex investor, you would come to know that they know the Forex market better than anyone else. They are able to predict the future trends accurately a lot of times and make their investments accordingly.
The Forex Exchange Market is the largest investment market in the entire world, and currencies worth trillions of dollars are traded every day. It goes without saying that the Forex market has a lot of potentials, and if you have a good understanding of the market, you can also make a fortune for yourself.
If you want to be a successful Forex trader, you must know how to read and analyze the Forex charts. We have already discussed different kinds of Forex charts, and how to read them. However, if you are finding it difficult to read these charts, there are several professional courses on the internet that teach you how to read these charts in-depth.
One of the best Forex courses you will find on the internet is Asia Forex Mentor's Ezekiel Chew. This course by Ezekiel Chew is one of the highest-rated Forex courses on the internet primarily because it is informative, and it has helped thousands of aspiring Forex traders.
One of the best things about this course is that it is suitable for both beginners, and experienced Forex traders. The course starts with teaching you the basics of reading forex charts and proceeds to teach you the more advanced methods, and practices used by Forex traders.
Following are some of the benefits you can expect once you start Ezekiel Chew's Forex trading course:
- Identify and use profitable strategies by learning how to implement them in Forex trading.
- Increase your income to a great extent in the long run by learning different strategies and techniques in forex trading instantly, that would then help you make sensible investments.
- Using this course, you can instantly increase your income by up to 30% or even more. You can see an excellent youth return on investment after investing in this course by up to 75% or even up to 200%.
- Get hands-on experience about Probability and get more information about winning ratios and how they can help you move forward in your career in Forex trading.
- You can start by learning how to perform Forex trading systematically rather than just beating around the bush and not knowing what to do next.
- Learn more and get more information about the price action and business behind trading. Get more information about trade management methods along with chat reading.
- Get more information about different strategies and trading plans and learn how to trade to win.
Conclusion: How to Read Forex Charts
There are different kinds of Forex charts. Some of these charts are simple to understand, whereas a lot of other charts can confuse even the most experienced traders. Just like every coin has two sides, each Forex chart has its benefits and disadvantages.
If you are a beginner in the field, we would suggest you start from line chart. It is effortless and straightforward because it contains only a single line that you need to identify. Line charts are easy to master, and if you can understand these line charts in-depth, it would help in boosting your confidence.
When someone is a beginner in the forex trading industry, many people suggest the many different types of charts, which is why it can be very overwhelming to make the right option in such a situation. That is why we have brought you a list of the main charts used in the forex trading industry and provided you with information to learn how to identify the behavior of the market by using the charts.
It can be very beneficial for you to learn how to read the main Forex charts because it will give you a lot of competitive advantage when trading compared to the other traders who do not know how to read the charts. If you want to make a strong presence of yourself in the forex industry as a beginner Forex trader, it will give you a lot of benefits to learn how to read these charts properly.


