Want to jump straight to the answer? The best stock brokers for traders are Tradestation and Tradier
The #1 Stock and Forex Trading Course is Asia Forex Mentor
Technical analysis is one of the methods deployed by financial markets' traders to generate their trading signals. They take time to analyze previous market data and use it to predict future price movements. There are several tools and technical indicators used in technical analysis. Pivot points is one of the popular indicators used in day trading.
In this article, we will discuss pivot points in detail; learn how to calculate pivot points, why we use them, and their different types. We will also look at support and resistance levels as well as day trading strategies. we’ve got Ezekiel Chew; the forex industry expert to share his take on Pivot Points.
What is Pivot Points
Pivot points were first used by Floor traders in the stock market to set their current price levels based on yesterday's high, and low prices. They record the high, low, and close prices of the previous trading day and use them to estimate the support and resistance levels of traded assets on the next trading day. In a financial market, the pivot point is calculated as the arithmetic mean of the previous day's high, low, and close prices.
With the advent of the internet and modern technology, floor traders are now few as most traders now use electronic trading via software trading platforms. In these trading platforms, Pivot points come as a technical analysis indicator used mainly by day traders to identify potential support and resistance levels where the price directions are expected to change. It also works well for short timeframes such as 1 hour, 30 mins, 15 mins, etc.
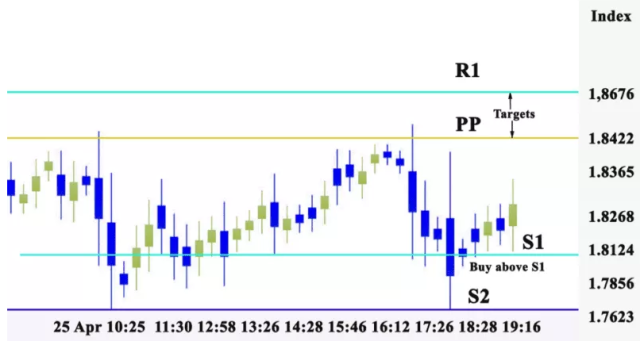
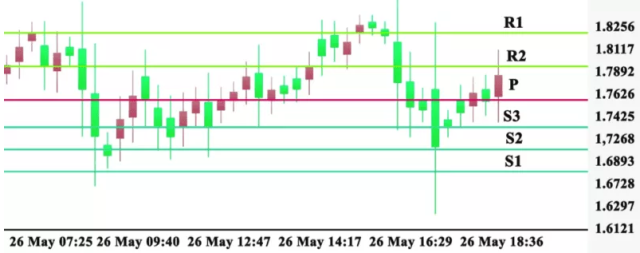
Pivot point indicators place horizontal lines on the charts at different pivot point levels. The middle line is the pivot point (PP) while support and resistance levels are represented with 3 lines below and above the pivot point respectively. The lines can be less than or more than 3 depending on the type of pivot points calculated.
Why use Pivot Points?
Pivot points technical indicator is best utilized by traders who wish to take advantage of short-term price movement in the markets. It is very easy to use so beginner traders who do not know much about technical analysis find it simple and interesting. It is also available on most trading platforms making it easily accessible.
Pivot points usually draw up to 7 lines on the price charts with the pivot line in the middle. This gives the trader multiple options for broader and more accurate analysis. It can also be used on the same chart with other technical indicators to confirm pivot point signals. In fact, it is best used with other analysis tools to increase your chances of accuracy.
In ranging markets, a pivot point can help the trader identify reversal points and so, place their orders. It can also help breakout traders easily find key levels where the price breaks will occur. Its high accuracy makes it popular and acceptable to many technical analysts.
How to Calculate Pivot Points
The pivot point is usually calculated as an average of the important price levels from the historical price action of a forex pair or financial asset. It is calculated from the previous high, low, opening, or closing prices. The formula below is used in its calculation:
Pivot Point (PP) = (High + Low + Close) / 3
After calculating the Pivot point, the support and resistance levels are then calculated as follows:
Resistance 3 = High + 2(PP – Low)
Resistance 2 = PP + High – Low
Resistance 1 = PP + (PP – Low) = 2PP – Low
Support 1 = 2PP – High
Support 2 = PP – (High – Low)
Support 3 = Low – 2(High-PP)
Different Kinds of Pivot Points
The following are the types of pivot points:
Classic pivot point
This is the standard pivot points indicator that is calculated as follows:
Pivot Point (PP) = (High + Low + Close) / 3
Resistance 2 = PP + High – Low
Resistance 1 = PP + (PP – Low) = 2PP – Low
Support 1 = 2PP – High
Support 2 = PP – (High – Low)
Once you have obtained the base pivot point, you can then calculate 2 pivot points' support and resistance levels each to make the five-point system.
Woodie pivot point
Unlike the classic pivot point that uses the difference between the high and low to calculate its support and resistance levels, Woodie pivot point calculation uses the range and closing price of the previous period.
Pivot point (PP) = (High + Low + 2Close) / 4
First Resistance (R1) = (2 x PP) – Low
Second Resistance (R2) = PP + High – Low
First Support (S1) = (2 x PP) – High
Second Support (S2) = PP – High + Low
Camarilla pivot points
This is similar to the woodies pivot points because the range and closing prices are used for calculations. But, the difference is that 4 support and resistance levels are calculated and a multiplier is used as follows:
P = (High + Close + Low) / 3
S1 = Close – ((High – Low) x 1.0833)
S2 = Close – ((High – Low) x 1.1666)
S3 = Close – ((High – Low) x 1.2500)
S4 = Close – ((High – Low) x 1.5000)
R4 = Close + ((High – Low) x 1.5000)
R3 = Close + ((High – Low) x 1.2500)
R2 = Close + ((High – Low) x 1.1666)
R1 = Close + ((High – Low) x 1.0833)
Fibonacci pivot points
This is calculated based on the standard pivot points method; only the support and resistance levels are calculated by subtracting the previous low from the previous day's high. The result is multiplied by the Fibonacci levels of 38.2%, 61.8%, and 100%. Then, the result is added to or subtracted from the pivot point.
Pivot Point = (High + Low + Close) / 3
S1 = PP – ((High – Low) x 0.382)
S2 = PP– ((High – Low) x 0.618)
S3 = PP – ((High – Low) x 1.000)
R3 = PP + ((High – Low) x 1.000)
R2 = PP + ((High – Low) x 0.618)
R1 = PP + ((High – Low) x 0.382)
Central pivot range (CPR)
This is a type of pivot point indicator that draws 3 lines on the charts with the Pivot point in the middle. The formula is as follows:
Pivot Point = (High + Low + Close)/3
Bottom CPR = (High + Low)/ 2
Top CPR = (PP – BC) + Pivot
Demark Pivot points
Tom Demark introduced these pivot points which are different from other pivot points they have a different formula and show only 3 lines. Demark pivot points are conditional on the relationship between the opening and closing prices. It focuses on recent price action. The formula is as follows:
If Close > Open, then X = (2 x High) + Low + Close
If Close < Open, then X = High + (2 x Low) + Close
If Close = Open, then X = High + Low + (2 x Close)
Pivot Point = X/4
Resistance 1 = X/2 – Low
Support 1 = X/2 – High
Support and Resistance Level

Support and resistance are important concepts in technical analysis because they help traders to find entry and exit points in the charts. Once a support or resistance level is attained, it is either the price bounces off the level and reverses its direction or it breaks through the level and continues in the same direction.
A support is the price level at which a downtrend is expected to subside as more buyers come into the market. Resistance is the level where a bullish trend losses its momentum as more sellers enter the market. Once the price enters the support or resistance zone, the trader is likely to mark his potential entry and exit points based on the expected price direction as it draws close to the support or resistance level.
Within a trading session, traders draw trendlines and use leading indicators like moving averages to help them identify support and resistance levels. They may also use other technical indicators to further confirm potential reversal or breakout points. When a pivot point system has been used to generate support and resistance levels, pivot point breakout or pivot point bounces are imminent.
Intraday Trading Strategies

In pivot point analysis, it is generally believed that if the market opens below or above the pivot point, the market is likely to remain there for the whole day. But, if it opens at the extreme support or resistance levels, it is likely to move back to the pivot point later in the day. Armed with this knowledge, day traders are likely to ignore the market sentiment within the day and target their trades accordingly.
Day traders usually open a long position when the price level moves above the first resistance level. Stop loss could be placed below the pivot point in case of market reversal. Similarly, many traders open short positions when the price movement drops below the primary support level. Stop loss can be placed above the pivot point.
You can also trade pivot points like traditional support and resistance. If the price action is moving towards a support level and you believe that the support will hold, you can open a long position. In the same vein, if the market has been bullish and price action moves towards the upper resistance level, you can open a short position if you anticipate a reversal.
Pivot point breakout is a technical analysis indicator that can help you identify price action breaks, where the price breaks through a pivot point price level. A combination of indicators may help a trader in making his decisions. Pending orders may also be used to place the orders so that market positions can only be opened if certain conditions are met.
Best Stocks and Forex Trading Course

The best Forex trading course is the One Core Program from Asia Forex Mentor by Ezekiel Chew. While trading skills are lucrative, it may take you so long to grasp what works and what doesn't. It builds your skills from the viewpoint of a new trader with fear into an advanced trader working with strategies.
Your best option is a great course. Trainers and mentors are aware of what will help you conquer the markets. Fumbling alone can waste your chance at a lifetime career in trading. A course helps you fast-track on a tried and tested model.
Many traders make a final stop at the One Core Program. Which is among the top ten credible courses you can bank on? Traders go on to hit six-figure trades following a proven model. It's a course that has helped retail and institutional traders transform their trading careers.


Best Stock Brokers


Conclusion: Pivot Points

Pivot points is a method used to detect where the price direction of a forex or stock asset is likely to change. The indicator draws horizontal lines on the charts with the Pivot point in the middle, resistance levels on top, and support levels below.
In calculating pivot points, the previous day's high, low, and close prices are used to determine the pivot point, support levels, and resistance levels. The formula used depends on the type of pivot point.
The types of pivot points are:
- Standard pivot points: also known as classic pivot points. The five-point system comprises PP, R1, R2, S1, and S2.
- Camarilla: which uses multipliers and draws 9 lines or pivot levels.
- Fibonacci pivot points: uses Fibonacci levels of 38.2%, 61.8%, and 100%.
- Woodie pivot point gives more emphasis on the closing price of the previous day.
- Central Pivot Range (CPR) is a simple pivot point indicator that draws 3 lines on the charts.
The pivot line and pivot levels help traders in trading trends and breakouts. But, more analysis can be provided by using other indicators to confirm the signals.
Pivot Points FAQs
How do pivot points work?
The pivot points indicator works by drawing lines on the chart with the major pivot line in the middle while the support and resistance lines are placed below and above respectively. The pivot level is usually calculated from the market data obtained from the previous trading day.
In a fast-moving environment or a trending market, the pivot line can help traders to make their trading decisions. Even in ranging markets, trading with pivot points is also applicable.
What are the best pivot points?
There are about five popular pivot points used in the financial markets; classic, Woodie, Fibonacci, Camarilla, and Central Pivot points. Each one of them is useful; so, it depends on what the trader hopes to achieve from his analysis.


