Want to jump straight to the answer? The best stock brokers for traders are Tradestation and Tradier
The #1 Stock and Forex Trading Course is Asia Forex Mentor
An economic recession can substantially impact the stock market; the share price is based on assumptions about a company's performance, and if investors believe the performance or profitability to decline, they won't be willing to take the risk. In COVID times, Southwest Airlines- the NYSE's biggest air transportation company- faced a slump in its trading value due to a lack of demand. The share dropped to its lowest in the last five years to 23 from a high value of about 58.
Similarly, most other transportation companies faced a similar decline in their value; however, there were some winners, too; some E-commerce and technology-based businesses rose in value to their highest market cap. Cumulatively, it can be challenging to understand how the market fared without using indexes. Today, S&P 500 is widely used by traders to understand the performance of the stock market as a whole.
However, it wasn't always the first choice, and in fact, it is a by-product of the original Dow industrial average index. In this blog, we will talk about a vital stock market barometer- the Dow theory, and how you can use it to your benefit. We have Ezekiel Chew with us to explain the critical concept; he has been affiliated with online investments for over two decades. His excellent command of the subject has made him a renowned specialist around the world. Let's use his expertise to understand the Dow theory.
What is Dow Theory

Before we talk about the Dow theory, it is crucial to understand the interlink between the economy and companies. The economy is dependent on business performances; a good business environment will result in a growing economy; similarly, falling business conditions indicate a dying economy.
The stock market is a combination of more than 500 different publicly-listed companies. Usually, these companies are at least a decade old, with an average age of about 32 years. Companies can be the correct gauge to judge the economy's performance.
If these companies are progressing in the right direction profit-wise, it is a good sign for the economy, and it's in the growth phase. However, if these companies are closing their operations or shutting down, it rings alarms for the state manager, indicating a fall in economic performance. An economy isn't easy to understand because not all companies will move in the same direction. Some may be incurring massive losses, while others would be operating in record profits.
For a trader, it is crucial to evaluate how the market has performed as a whole so that better decisions can be made. In 1896, Charles dow created an intelligent index to judge the performance of an economy. The theory was published in the wall street journal and bought praise from analysts worldwide.
The dow theory says a market is in a progressive state; if either the industrial average or transportation average moves above a previous high, the rise of the first average will be supported by the other standard in the intermediate term. Nonetheless, a trend change can only occur if both indices follow each other. Let's get a better grip of the dow theory by the averages.
What is Dow Jones Industrial Average

Most investors don't usually keep their investments in a single stock; they prefer diversifying them in multiple blue-chip stocks. These companies generally have strong profitability and stability over the years, with few risks involved.
For instance, an investor may buy stocks of Coca-Cola, Tesla, and Apple; all these companies are from different sectors. Thus, they will have different growth in a given period.
Nonetheless, an investor would want an overview of the portfolio's performance. Dow Jones Industrial Average is an index catering to the price movement of the 30 blue-chip companies listed on the New York Stock exchange. The index averages the stock performance of the best industrial companies in the country and provides an overview of the market trends.
The Dow Jones industrial average has been one of the most followed indexes amongst investors; as it considers the strongest business, the index provides valuable information about the economy and how it has performed over a period.
The DWIA had immense importance to investors in earlier periods; it initially included the 12 highest market cap companies on the NYSE. Any company with a significant decline in the market cap may be removed from the index to provide a fair view.
What is Dow Jones Transportation Average

Transportation businesses have always been the core of any economy; their rising profitability means growth of the economy- the more the inventory turnover, the higher the demand for transport.
However, their importance to any economy's growth has declined in recent times as technological companies seem to take over. When the Dow Jones transportation average was first formed, transportation had immense importance.
It was the late nineteenth century, and the world was experiencing an industrial revolution. Manufactured goods needed to be transported around the country and abroad to agricultural countries; hence, the importance of the transportation sector couldn't have been exaggerated. The Dow Jones transportation average, also known as Dow transports, caters to the 20 biggest transportation companies listed on the NYSE.
It weight-averages the performance of the top 20 transportation stocks and represents it as an index value. The index initially included nine companies, all of which were railroad businesses. However, as the importance of other modes of transportation grew, 11 more companies were added to the list, including air, delivery, marine, and trucking companies.
The two averages are fundamental to the Dow theory; when any index crosses its prior high, the other index follows it within a few weeks. It is an indication of economic growth and highlights a positive business environment.
Principles of Dow Theory Explained
Dow theory was created in about 1896, and more than one century has passed since its first publication in the wall street journal. The idea was never formally published by the creator as he died in 1902; there were various advancements over time, and several changes were made to the indexes. However, the fundamentals of the theory have stayed the same ever since. The Dow theory has six principles.
- Stock prices reflect the company's future: it suggests the stock prices reflect the company's performance, competitive advantage, management potential, and future risks, even if the individual investors aren't aware of the information.
- There are three types of market trends: primary trends, secondary trends, and minor trends.
- Primary trends have three phases: accumulation phase, markup/public participation phase, and distribution phase.
- Indices must confirm: for a new trend to begin, both the indices must be in the same primary trend. An upward trend for one index while the other index remains in a lower trend doesn't indicate a shift in the primary trend.
- Volume indicates the authenticity of a trend: volume should move according to the trend; the volume should increase if the price moves towards the upward trend and decline if the price is against it.
- Trend reversal occurs with clear indication: sometimes, technical analysis may be difficult for reversal of the primary trend; an upswing in the bear market may signal reversal, but it can also possibly be a rally followed by further lows.
The six principles are used together to attain the best results from the dow theory; if you are confused about their meaning, the following few subheadings will explain them in detail.
3 Kinds of Market Trends
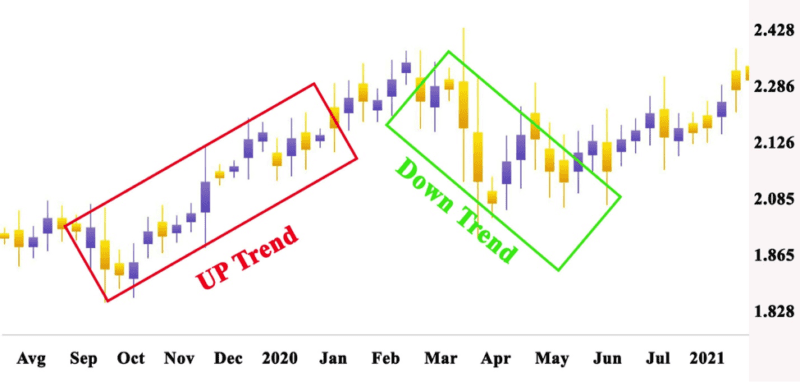
The stock market reflects the investor's confidence; the changes in economic conditions are shown by the market trends. A bear market indicates low investor confidence; it refers to investors withdrawing their investments after falls in stock prices due to wars or other external interferences.
A bull market is the opposite; it follows high investor confidence, investing in low-lying stocks with the hope of rising soon.
A bear or bull market makes the primary or major trend; they tend to last for about a year. During the period, the market may have sudden moves going against the major market trends. For instance, the market may have an upswing or rally during a bear market or a dip during a bull market. These secondary trends would last for about three months.
During the secondary trends, there may be minor trends of erratic movement; these movements are extraordinary and may create noise in the stock charts. You may see a series of minor trends every few weeks after stock speculation. It is usually the time for smart money to make profits from shying newbies.
Dow Phases in the Bull Market and Bear Market
The Dow theory suggests that within a primary trend, we have three phases, indicating a different investor mindset. Usually, a bull market won't necessarily have high investor confidence at the beginning; the smart money movement creates rapid movements in the stock charts.
For the bear market, investors won't necessarily withdraw their investments in the beginning; they may allocate their assets to minimize the impact of price falls; however, as the market primarily declines, they are forced to create changes later in the period.
A single phase may last for about four months before progressing to the next level; the movement during the phases creates support and resistance bands for a stock, which shall later be used for stock speculation. Let's discuss the stages in more detail.
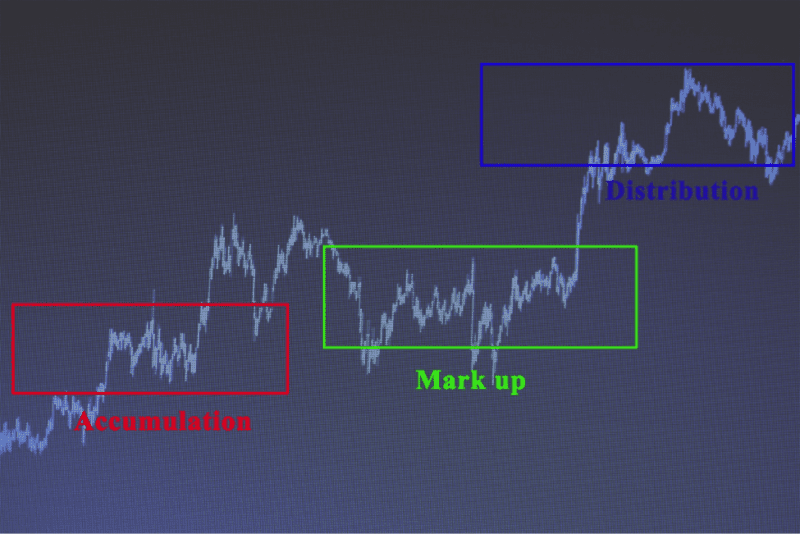
The Accumulation Phase
The first primary trend in a bull market is the accumulation phase, an aftermath of a massive fall in share prices. Once the stock prices have fallen, investors are averse to purchasing; they fear losing their investment by spending it on falling stocks.
Smart money steps in to mark the initiation of the phase; before the accumulation phase, the market usually falls from a high, and it serves as an ideal opportunity for institutional investors. The shares are available at a low price, and once the price rises, they could be sold for high profits.
During the accumulation phase, general investors try to sell the falling stocks to reduce their losses. The increased demand prevents the stock price from falling beyond a particular mark; it forms support in the long run. The phase usually lasts for about three months.
Markup Phase
Once the institutional investors have bought the majority of floating shares, it creates a positive air in the business world, and the falling confidence is strengthened. The stock market starts to grow, and prices rise. It is when technicians and high-end analysts begin to enter the market.
General investors are still waiting for a surety of rising, but some may still let their fear of missing out overpower risk averseness. At about the mid-markup phase, the previous norms and historical records are challenged, and the volume increases significantly. It marks the entry of new investors with the aim of making it big.
While the public money enters the market, the smart money begins to unload. The institutional investors offload a fair proportion of their shares for increased prices resulting in profitable trades. A selling climax occurs at the end of the phase; the sidelined investors come in with investments and boost stock prices. It causes a rapid movement in a short price, indicating an end.
Distribution Phase
The distribution phase marks the end of a primary trend; it is the time when the stock market has risen to its highest, and the smart money starts unloading its stocks. However, the public sentiment is still positive, and new investors see it as a chance to maximize their returns.
There is a massive influx of investments, and the general public starts buying stocks from institutional investors. Once the stock rises to a high, the smart money investors put their stocks on sale, creating a resistance level. The investors successfully sell their stocks within about three months, and the stakes are with the public.
Once the support is taken off, the market enters a downward spiral, and public investors are frustrated. They start selling their stocks, and the market has negative price movements. It is difficult for investors to determine whether to sell stocks or wait for future rises. Usually, the greed of more ends up in worsened losses.
Dow Sell Signal

Dow theory signals cater to buyer and seller sentiments; if a market looks to have an increased supply, Dow will create a sell signal to help investors retain profits; similarly, lower supply and low sentiments mark the buy signal.
In a bull market, the sell signal is created after the stock market hits a high and starts declining; the next rally occurs but goes down without hitting the previous highs. At this point, it is the best time for investors to sell and make a profit.
In a bear market, a sell signal is created after the stock prices cross recent average lows. It is usually an uptrend rebound and serves as a good opportunity for investors to make profits.
Dow Buy Signal

In Dow theory, signals are created by the secondary trends; an unusual shift is a signal to act for investors. Once a bear market is established, bull investors shall come in to raise the stock prices. A bear market sell signal will require an uptrend rebound.
Once a secondary trend can be spotted, it is time to buy new stocks. The pullback should go beyond 3% and hold the position for at least a few weeks.
Best Stock and Forex Trading Course

There is no doubt all these things may seem a bit technical to follow. In fact, the price makes so many wild swings each day that it can be very hard to measure buying pressure or selling signals. Also, learning all the technical analysis you need for forex takes more than just a day. Instead of relying on the odd article here and there, you may want to get a full detailed course to take you through all these situations.
Here is where the idea of the Asia Forex Mentor by Ezekiel Chew comes in. The course is a robust introductory guide that will give you the knowledge you need to trade forex. It's a beginner-friendly guide as well that works for folks who want to trade forex and any other financial asset.
The Asia Forex Mentor will not just teach you how to predict price shifts, daily volume, and these other technical indicators. It will also teach you how to manage capital and explore some of the most advanced risk control measures in the world. After all, as long as you are managing your capital correctly, identifying overbought and oversold pairs will be the easier part.
Also, if you are an advanced trader looking to learn some of the tricks used by leading banks, this course is also ideal. As a matter of fact, The Asia Forex Mentor is developed by someone who has taught some of the leading investment bankers how to trade forex. You will be able to identify a losing trade, gauge price movement under immense trading pressure, and maintain a level head even when the markets are volatile.


Best Stock Brokers


Conclusion: Dow Theory

The stock market is an exciting subject; its variations provide a fantastic way to earn income. The Dow theory analyzes the economy's conditions based on industrial and transportation indexes. Both indexes are crucial for traders involved in real-time trading; they provide simplified information that may help traders make decisions about their entry and exit.
The Dow theory is built on six principles that determine the application of the idea to the real world. It considers that the market discounts everything, and a stock's value represents its future prospect. The primary trends may vary between a bull or bear market. Every primary trend has multiple secondary trends, which include minor movements.
The secondary trends are a signal for traders to act and make a profit from their dealings. An uptrend rebound during bear markets or a bull market rally is the right time to sell your stock for a profit. However, the Dow theory must be studied in detail to ensure full benefit. Sometimes, you may end up confusing a reversal with secondary trade or vice versa.
Confusion is always dangerous, and a slight error can lead to massive losses with your investment at stake. No investment can be an overnight success; you need to be well aware of how the market works before you play your trading cards. Initially, the goal shouldn't be to maximize returns; instead, you should aim at learning the most about the market.
If you can use available information correctly, the portfolio growth will be some good deals away. Although Dow theory was launched more than 130 years ago, it's still widely used due to its efficacy and trustworthiness.
Dow Theory FAQs
What is the Mean Reversion Strategy?
The mean reversion strategy is built around the idea of stocks reverting to their average prices. Market volatility and movements may cause the price to change over time, and once the market settles, the stocks will expectedly return to their mean prices.
However, the strategy may not always stand true. Significant changes in market competitiveness and internal affairs may result in changed average prices.
Does Mean Reversion work?
Mean reversion has been a technique for long-term investors. Usually, the strategy is reliable and may bring positive results, but sometimes, the results may go wrong. Historically, some companies have lost their importance, while technology-based enterprises have risen amongst the ranks.
Hence, these companies may not revert to their averages and may incur losses for traders.


