Want to jump straight to the answer? The best Stock Brokers are Tradestation and Tradier
The #1 Stocks and Forex Trading Course is Asia Forex Mentor
Traders and investors use several techniques and tools to assess the movements of prices when trading in stocks and other financial instruments. These indicators include Moving Averages, Relative Strength Index, and Volume Price Analysis. We’ve got Ezekiel Chew, a well-known consultant and mentor for many in the stock and trading world, to share his take on Volume Price Analysis.
In this article, you will be provided with an understanding of what volume price analysis is and why it is used. Moreover, the article will also guide you on how Asia Forex Mentor can assist you in planning your trading strategies and earning six-figure returns.
What is Volume Price Analysis
Volume Price Analysis is one of the frequently used trading techniques to assess the price movements in a market and then make informed and smart decisions. With trading, there is a risk, and every trader wants to minimize this risk and earn maximum returns on a certain investment. To do this, it is necessary to understand the stock market, how the price fluctuates, and how you can benefit from the favorable movements.
Volume Price Analysis indicates the relationship between the prices of a financial instrument with the volume. For example, the supply and demand ratio largely affects the prices of a stock, such as when investors start purchasing a certain asset or stock, the prices and market of that asset will move up. Conversely, if they start selling this asset, the value and price of the stock will decrease, and the market may even crash.
There are two phases of a market: the Accumulation Phase and the Distribution Phase. In the accumulation phase, traders (sellers and buyers) start to gather in the market, and the balanced position of the market begins to change into an imbalanced position. On the other hand, the distribution phase paves the way for identifying a single fair price where the balance can be restored. At this phase, one side (buyers or sellers) dominates the other, which leads to a price change of the asset.
Why is Volume Price Analysis Important
Securities are traded continuously in a trading market. The number of securities trading at a particular time is identified through a volume analysis. This technical analysis is imperative in indicating the likelihood of success in a trade.
Analysts use this information to determine the impact of price changes on the returns achieved. Since the volume of trading at a particular period can affect the price of that security, thus having an understanding of the price-to-volume relationship is necessary for taking steps to maximize returns.
Volume Price Analysis is an excellent tool for confirming and checking trends and chart patterns. These patterns include head and shoulder, flags, and triangles. This tool is often used by traders especially experienced traders. A high asset volume usually means the patterns will confirm. It is then noted that any sudden drop in the price of the asset when large volumes are being traded means something would have triggered the fall. For example, the drop in prices may be due to economic conditions, economic or financial news releases, or an interest rate decision.
On Balance Volume
On Balance Volume is an important indicator that demonstrates the relationship between price and volume when trading in a stock market. It measures the total cumulative volume by adding and subtracting volume during up and down days, respectively. If the closing value of the asset is higher than the previous value, the entire volume during the day is considered to be an up volume.
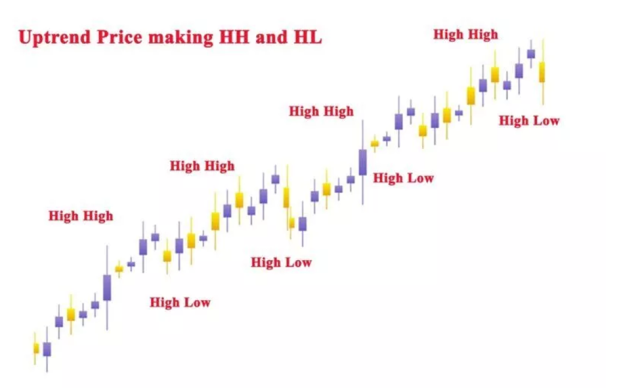
When using the On Balance Volume indicator, it is unimportant to analyze the actual value, and rather traders should keep an eye on the direction of the OBV. The upward trend is expected to continue if the On Balance Volume and the price are both making higher troughs and peaks. However, the downward trend is likely to continue when they have low peaks and troughs.
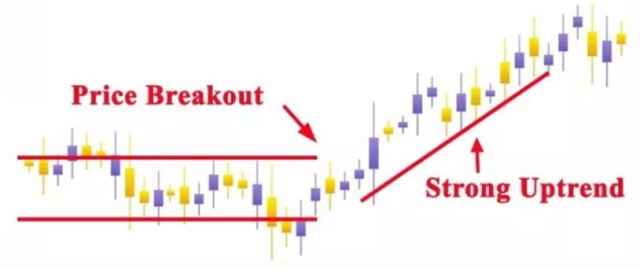
When the OBV rises during a trading period, it indicates an accumulation phase taking place and is thus a signal of upward breakout. On the other hand, if the OBV falls, it means a distribution phase is taking place, and it provides a warning of a downward breakout. Furthermore, if the price continues to rise but the OBV fails to do so, it is called negative divergence, and the upward trend is likely to fail.
Key Factor of Market Structure
The supply and demand in a market affect the price of the security, and hence if buyers hold a dominating position, the price of the security rises. However, if the sellers outweigh the buyers, the price falls.
Therefore, the price moves at each moment depending on the volume traded. For example, if there is a market order for buying 10 lots of a security with a 1 lot volume for the nearest selling order, the assets bought and redeemed until the last 10th lot will create an upward movement in the price of the asset. This situation usually occurs during the accumulation stage; thus, it is important to identify the market stages to know when the volume is the greatest.
The accumulation phases act like support zones which, when combined with those at different time zones, provide relevant and reliable indications of the market trends. Analyzing the phases and the trading volumes at a particular period provides the investors with a clear picture of who dominates the market and reacts accordingly.
What is the Volume-Weighted Average Price
Many traders use the volume-weighted average price to get an insight into the value and trend of the security. It is an excellent tool that serves as a benchmark for a security’s everyday average trading price. In addition, this technical indicator is commonly used on intraday charts for every new trading period.
The VWAP can be used as a means of trend confirmation with trading rules built around it. Investors may categorize stocks according to how high or below their prices are compared with the VWAP. For example, stocks with prices lower than the average are considered undervalued, and those with higher prices are considered overvalued.
Therefore, it becomes easier for the investors to make decisions as when the undervalued stock goes through an increase in price, they may decide to continue investing. However, if the overvalued stock falls below the VWAP, the investors immediately sell their securities or opt for short-term investments.
In addition, VWAP is also used by mutual fund owners and other institutional buyers who seek ways to trade without having a significant impact on the market. They will thus buy at a price lower than the average and sell at higher prices. This prevents the prices from drifting away from the average.
VWAP only works for a single day and needs to be restarted for each new trading day. Creating an average for many days can portray a wrong picture of values and prices and may distort the decision-making process.
Market Stages Accumulation and Distribution
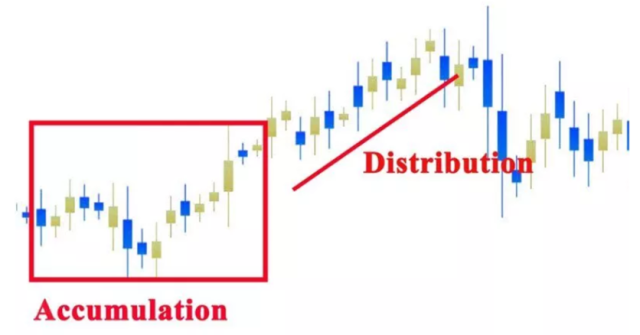
As discussed earlier, accumulation and distribution are two significant phases of a market and play a key role in assisting investors in making informed decisions. They are another kind of volume indicator that involves the use of opening and closing prices of a security.
A positive figure on the indicator reflects higher prices compared to those at the opening, whereas a negative figure means the prices are lower than the opening prices. If there is a vast difference between these two prices, it would mean that there has been a lot of trading activity with strong accumulation and distribution phases.
The highs and lows of A/D should be carefully interpreted and understood as they may say a lot about the trends in the market. For example, a lower upward-trending market is reflected by high opening and lower closing prices. When the volume increases before a sell-off, it is imperative to combine various indicators like volume, fundamentals, and technical.
Is Volume Analysis Market Bullish or Bearish
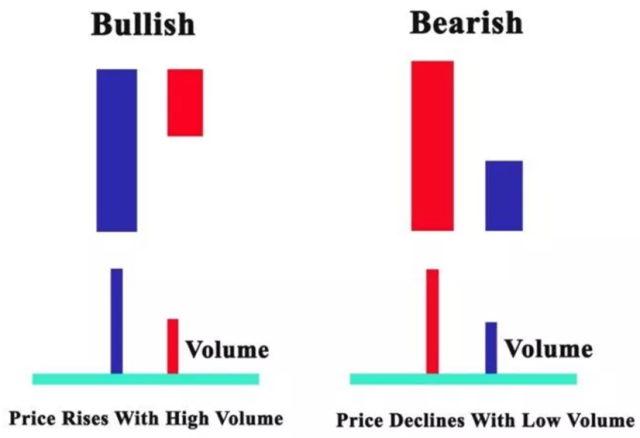
When analyzing the price-to-volume relationship, defining volume as either Bearish or Bullish is the first step. This identification is based on the direction of the price. When the price moves downwards, the volume is considered a Bearish volume, and the price upside volume is called a Bullish volume. According to this, the surges in volume and volume moving averages during a fall in price are considered Bearish volume surges, and the volume and MVA increases during a rise in price are called Bullish volume surges.
There are three main indicators of identifying a bullish and bearish volume. First, a comparison with the previous bar price is an excellent way. It is considered a bearish volume when the current closing price is above the previous one, whereas it’s a Bullish volume when the current falls below the previous closing price.
Next, you can identify a trend by plotting a moving average to see the direction of price movements. When the price surpasses the moving average, it is considered a Bullish trend, and the volume is said to be a Bullish volume and vice versa for the Bearish trend. Additionally, price-based technical indicators such as RSI, MACD, and others can be used. This method is most effective for mathematical models such as Market Volume Oscillator (MVO) development.
Trading the Volume Price Trend Indicator
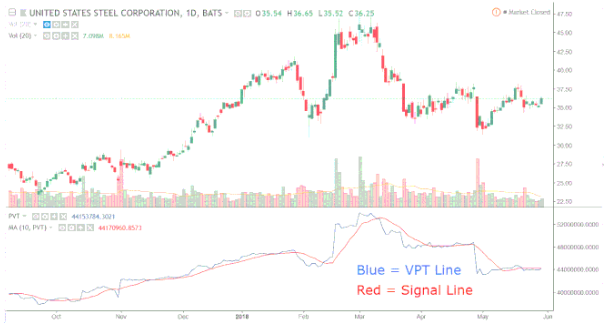
One effective stock market indicator is the Volume Price Trend Indicator which further helps in understanding the link between volume and price of a security, along with predicting the price, its magnitude, and direction. This indicator uses percentage changes when assessing the trends rather than only adding and subtracting volumes like other price volume indicators.
VPTs are frequently used by traders and investors to identify any divergences of the stock price away from the indicator. The occurrence of such a situation means a change in price and market direction. For example, price increases in the presence of a constant volume reflect a weak price movement that can be reversed anytime. Hence, traders who know this avoid long trades.
Best Stock and Forex Trading Course

Asia Forex Mentor offers the best forex trading education in Asia. The course is set up so that you can earn money while learning. You'll be able to trade forex profitably with a skilled trader's help. In Singapore and other sites worldwide, tens of thousands of people from the United States, the United Kingdom, and other Asian countries have been taught.
Ezekiel Chew's teaching method is founded on the principle of return on investment, which states that if you invest $1, you will gain $3. It's not about zany strategies or elaborate procedures. Professional traders and financial organizations use his authorized system. He is the driving force behind the growth of various companies, including DBP, the Philippines' second-largest state-owned corporation.
Due to his strategy's effectiveness, many full-time traders have joined the program with little to no prior trading experience and emerged successful.


Best Stock Brokers


Conclusion: Volume Price Analysis

Volume Price Analysis is a useful tool that most investors and traders use when making investment decisions. All analysts perform volume analysis for securities in the financial market. It is, however, crucial to differentiate between the volume of the entire market and that of a single holding. For example, volume generally means the number of shares traded in a day.
Volume charts are a useful resource for analysts that can be added to the daily charting diagrams and show the moving average trend lines. Basing investment and trading decisions on volume provides a more balanced view and helps produce more informed and thorough decisions keeping in view the changes in the market trends.
Volume Price Analysis FAQs
How do you analyze volume price?
Volume analysis can be used to identify relative and absolute changes in the trading volume of an asset which can be used to make future predictions on price movements and forecasting market direction. The analysis provides an investor with knowledge of where the price will move so that they can make informed decisions. The volume can affect the price of any security as when the volume of purchases of assets increases at a given time, it pushes the price of that security above since the demand increases. In contrast, when sellers dominate the market, and large volumes are sold, the price falls.
What does price volume indicate?
The price volume indicator provides an insight into the supply and demand relationship, which further helps in reaching a balance between the two. It may also reflect the strength of a market as high volume usually means a strong and active market. The indicator includes a cumulative volume line which, taking into account the upside or downside asset movements, adds or subtracts the price changes in the price trend and volume of the share or security.


