Want to jump straight to the answer? The best stock brokers for traders are Tradestation and Tradier
The #1 Stock and Forex Trading Course is Asia Forex Mentor
Investors are not oblivious to the market's volatility, which is beyond their control. However, there must be a mean of watching the market trend to guard assets and investments. To monitor the market price action trends, a channel band has been devised to determine the bullish and bearish trends in the market.
Chester Keltner introduced the channel known as the Keltner Channel. The Keltner Channel is a volatility-based band placed on either side of an asset's price to identify the trend direction of the asset. Simply put, the Keltner Channel is a volatility-based technical analysis indicator to determine the direction of a trend in the market.
For this article, we have Ezekiel Chew, a renowned and seasoned forex mentor, to elaborately explain the whole concept of the Keltner Channel. Scroll down the article below to further understand the Keltner Channel principle so that you can start applying it to your trading activities or decisions.
What is a Keltner Channel
The investment world is full of uncertainty due to the volatility of the financial market and regular market fluctuations due to external and internal factors. Still, there is always a way out, and that is to monitor the price changes and trade signals using the Keltner Channel.
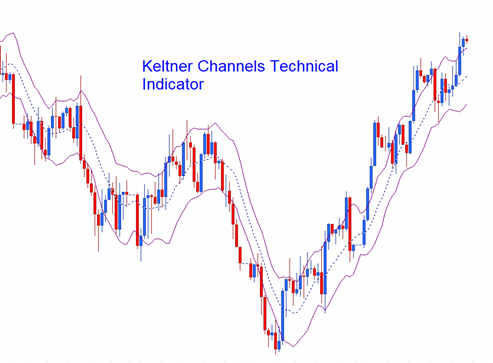
The Keltner Channel is a volatility-based technical analysis indicator regularly used to identify price movements, determine the trade, and provide trade signals. This technical analysis indicator comprises three separate lines, the upper, lower, and middle lines which are obtained either through the average true range (ATR) or the volatility.
The Keltner Channel has two bands, the upper and lower bands, which are set to twice the average true range (ATR) with breaks above and below the exponential moving average (EMA), typically 20 periods; this creates a channel-like pattern.
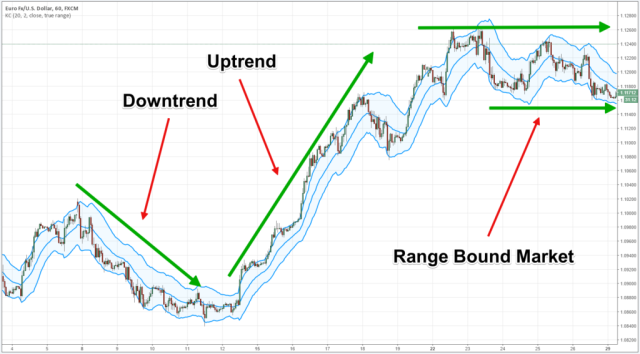
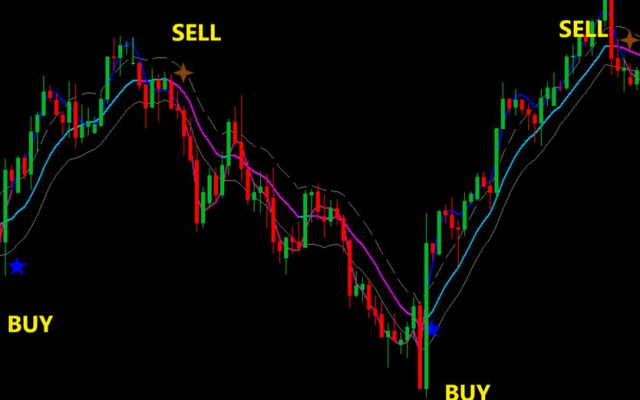
With the upper and lower bands and the movements of the three separate lines, the price action can be determined to know if it's bullish or bearish. The angle produced in the Keltner Channel also identifies trading ranges as the price varies between the lower and upper Keltner Channel bands, which can be read as support and resistance levels.
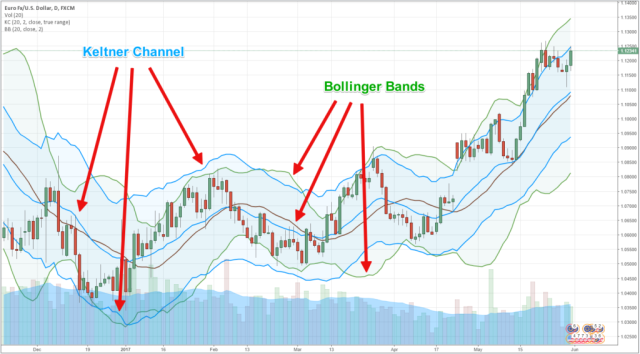
Keltner Channel and Bollinger Band are technical analysis indicators with three lines used to calculate the upper and lower bands. Still, the difference is that while Keltner Channel uses the average true range to calculate the bands, Bollinger bands use standard deviations.
Using the Average True Range
The Keltner Channel we know today all started in the 1960s by a grain trader named Chester Keltner initially; he began with a simple moving average (SMA) and the high-low price range to measure the upper and lower bands. Subsequently in the 1980s, Linda Bradford Raschke worked on the technical analysis indicator and progressed to the average true range (ATR), which is still in use to date.
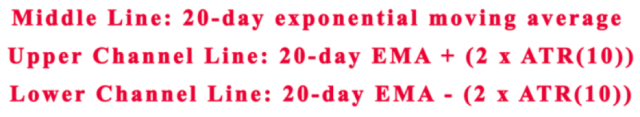
The Keltner Channel is a volatility-based technical analysis indicator with three separate lines, the middle line, which is the exponential moving average (EMA) of the price, and the upper and lower lines, which are positioned above and below the EMA.
The upper band is typically positioned to twice the ATR above the EMA, while the lower band is generally positioned to twice the ATR below the EMA. As volatility expands and contracts, the upper and lower bands also expand and contract as measured by the ATR.
This trading strategy aims to know when the price changes since most price actions are within the upper and lower channel bands, a closing price over the upper channel line is a strong bullish signal, and a closing price over the lower channel line is a bearish signal. The direction of the channel lines, such as up, down, or sideways, can also aid in identifying the trend direction of the asset.
Keltner Channel Methods
There's no particular way to use the Keltner Channel, so each trader largely determines the best Keltner Channel settings to use for his market.
Suppose the technical analysis indicator observes a longer EMA. In that case, the channel lines won't react quickly to the price changes because of the lag, but if a shorter EMA is observed, the upper and lower bands react quickly to the price changes, which might make it difficult to identify the true strong trend direction.
The multiplier of the ATR can be adjusted based on personal preference. A bigger multiplier of the ATR to create the Keltner bands implies a larger channel, which causes the price to hit the bands rarely. A smaller multiplier of the ATR to create the bands causes them to be closer together, implying that the prices will exceed or reach the bands regularly.
Also, traders can use the angle of the Keltner Channel to identify trend direction; as the channel rises, the price increases as well, while as the channel falls or moves sideways, it implies that the price drops or moves sideways as well. The Exponential Moving Average (EMA) is usually over 20 periods.
Keltner Channel Calculation
The Exponential Moving Average (EMA) is usually over 20 periods
Average True Range (ATR) is usually over 10/20 periods
Keltner Channel Upper band is EMA + 2× ATR(10)
Keltner Channel lower band is EMA – 2× ATR(10)
Keltner Channel's middle line is EMA
• Select the length for the exponential moving average
• Select the periods (either 10 or 20) for the ATR
• Find the multiplier for the average true range
The Average True Range (ATR) is the major determinant of volatility; short timeframes, such as 10, mostly cause a volatile average true range, while longer timeframes create a less volatile average true range and a steady trade signal. A longer exponential moving average will create a larger lag which will lag in price, while a shorter exponential moving average will create a smaller lag.
Keltner Channel Upper and Lower Bands
Keltner Channel has three separate lines, the middle, upper and lower lines, and the upper and lower bands are positioned above and below the EMA respectively.
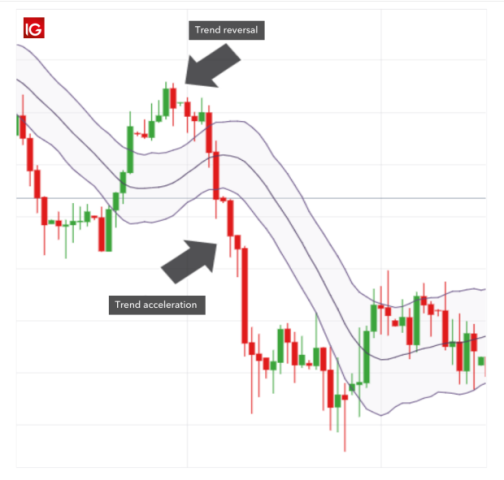
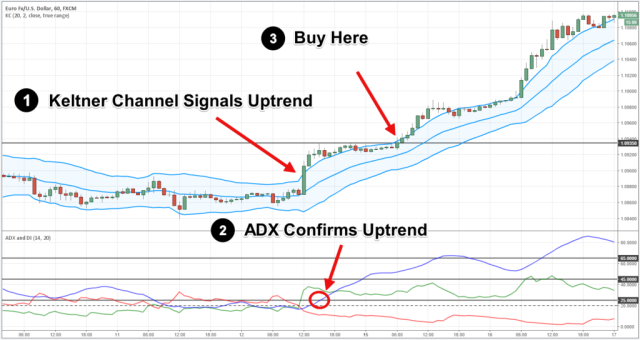
The upper band is positioned twice the ATR above the EMA, while the lower band is positioned twice the ATR below the EMA. If the price moves above the upper band in the market, it implies that the price changes show strength, and if the channel is further bent upwards, an uptrend is forming. If the price moves below the lower band, it implies that the price changes show weakness and if the channel is further bent downwards a downtrend forms.
When the price moves towards the upper band and not the lower band, it signals that when the price eventually reaches the lower band, the uptrend is losing momentum. When the price is moving towards the lower band and not the upper band, it is a signal that when the price will eventually reach the upper band, the downtrend is near an end.
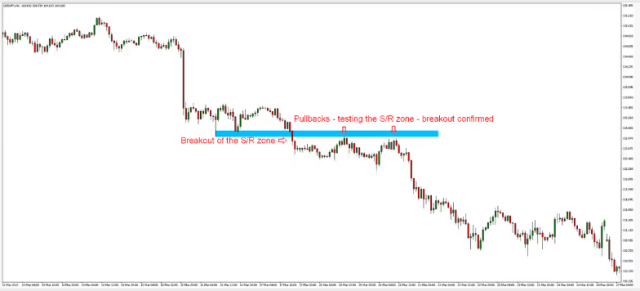
If the price is moving sideways between both the upper and lower bands, traders can use the bands as support and resistance. This means that traders can buy when the price is at the lower band and when the price changes and moves to the upper band they sell.
After the price moves sideways and the price breaks above or below the Keltner channel and the channel starts to angle in the same direction, it may signal that one new trend is underway in that breakout direction.
Trend Pullback Strategy
The Keltner Channel Trend Pullback strategy is that if the price action breaks above the upper band, traders should consider initiating long positions while exiting short positions. If the price action breaks below the lower band, traders should consider initiating short positions while exiting long positions.
This implies that traders should purchase in an uptrend if the price is at the middle line and initiate stop loss in between the middle and lower bands, and place a target price close to the upper band. If the price is striking the stop loss in the process, reposition to the lower band.
While traders should sell less in a downtrend if the price is at the middle line, they should also place a stop loss between the middle and upper bands and a target price close to the lower band.
This trading strategy maximizes the trending tendency in the market and helps traders effectively manage their risk ratio since the stop loss is half the target price length.
The Breakout Strategy
The Keltner Channel breakout strategy is a trading strategy used to fill in the space that the trend pullback strategy missed. This strategy can only be used near a significant market open because of its high volatility.
The breakout strategy is best applied to digital assets that are not static; that is, the assets have a high tendency for trending moves. This strategy is not for assets that are static and do not have any tendency to move.
The principle behind this strategy is to purchase if the price action moves above the upper line and to sell less if the price action moves below the lower line within the first 30 minutes after a major market opens. The middle band is the exit point for the trade if the price is at the middle band.
Trade only two signals for the breakout strategy within the first 30 minutes after the market opens because the market is volatile immediately after the market opens. If nothing significant happens within this period, nothing else can happen.
Keltner Channel Limitations
The extent to which the Keltner Channels will be useful largely depends on the best Keltner Channel settings used by traders. Traders should first know how to use the technical analysis indicator before applying it to the trade. Unfortunately, some of the applications of the Keltner Channel won't work if the upper and lower bands are either too far from each other or too close together.
As much as Keltner Channels can be used to identify trade opportunities and determine price action, they may also not act as support or resistance and might not be able to offer predictable potential, which could be a result of the Keltner Channel settings used.
Keltner Channels can be used to evaluate trade signals and produce trending signals. Still, to achieve the right results, the best Keltner Channel settings must be used in line with technical analysis.
Best Stock and Forex Trading Course

Asia Forex Mentor offers the best forex trading education in Asia. The course is set up so that you can earn money while learning. You'll be able to trade forex profitably with a skilled trader's help. In Singapore and other sites worldwide, tens of thousands of people from the United States, the United Kingdom, and other Asian countries have been taught.
Ezekiel Chew's teaching method is founded on the principle of return on investment, which states that if you invest $1, you will gain $3. It's not about zany strategies or elaborate procedures. Professional traders and financial organizations use his authorized system. He is the driving force behind the growth of various companies, including DBP, the Philippines' second-largest state-owned corporation.
Due to his strategy's effectiveness, many full-time traders have joined the program with little to no prior trading experience and emerged successful.


Best Stock Brokers


Conclusion: Keltner Channel
A trader who wants to make profitable investments and secure his assets must be very familiar with a technical analysis indicator such as the Keltner Channel that can help monitor the trend of price actions and differentiate between the typical and average prices in the market.
The Keltner Channel is a volatility-based indicator with three separate lines reflected on the average true range (ATR) with upper and lower bands above and below the middle line, which is the exponential moving average (EMA). The channel lines influence the price action on the market; the price striking the upper Keltner Channel band is bullish while the lower Keltner Channel band is bearish.
Trend signals are volatile and can be dynamic; hence, apply the techniques listed in the article above to identify and know the trading strategy to adopt. Traders can use the Keltner Channel to position an opening into strong trends by trading with the pullback strategy or buying with the breakout strategy.
Keltner Channel FAQs
Is Keltner Channel profitable?
The settings used significantly impact how beneficial the Keltner Channels are. Traders must first choose how they want to use the indicator before configuring it to support that goal. The bands must not be too close or too far apart for some of the Keltner Channel applications discussed above to function.
While Keltner Channels can aid in determining trend direction and offer some trade signals, they are most effective when used with other technical indicators, price action research, and fundamentals when trading for the long term.
What does Keltner Channel Indicate?
The Keltner Channels are a helpful technical indicator for day traders since they identify the current trend and provide trading signals. The indicator plots upper, lower, and middle lines using average prices and volatility. The three lines make an image resembling a channel as they follow the price.
The trader should consider opening long positions while closing short ones if the price action breaks above the band. The trader should consider opening short positions while closing long or bull positions if the price action breaches below the band.


