
Want to jump straight to the answer? The best Stock Brokers are Tradestation and Tradier
The #1 Stocks and Forex Trading Course is Asia Forex Mentor
In financial markets, investors need to know the trend of stocks using the relationship between the stock's price and volume flow to know whether to accumulate more stocks or distribute more. This stock trend will help them know the current market trends and help them make wise decisions for the trading day using the price charts.
The accumulation distribution indicator is a momentum indicator that traders use to predict a price trend reversal. It uses the relationship between the volume flow and the stock's price data and acts as a leading indicator of price movement. The divergence between the volume flow and the stock's price indicates if the stock is giving a bearish divergence or bullish divergence.
Ezekiel Chew, a renowned and seasoned forex mentor, teacher, and expert, will elaborate on the accumulation distribution indicator concept. So, read through the paragraphs below to understand the accumulation distribution indicator as an investor so that you can implement it in your trades and make wise decisions.
What is Accumulation Distribution Indicator

An accumulation distribution indicator is a volume-based technical indicator that is used to identify the trend of an asset by using the divergence between the stock price and the volume of such asset, as it helps investors to identify a bullish or bearish divergence between the stock price and volume flow.
Initially, Marc Chaikin , the developer of the accumulation distribution line, referred to the indicator as a cumulative money flow line to measure the cumulative flow of money into and out of a financial asset.
Accumulation refers to the increasing demand for an asset, while distribution refers to the increasing supply of an asset; with this accumulation distribution, investors can know the current trend of the market.
The accumulation distribution indicator is also a cumulative indicator that uses money flow volume and price to determine when a stock is being accumulated or distributed such that one period's value is added or subtracted from the last. The accumulation distribution line measures an asset's underlying supply and demand by monitoring the close price location within the period's close range and multiplying it by the volume.
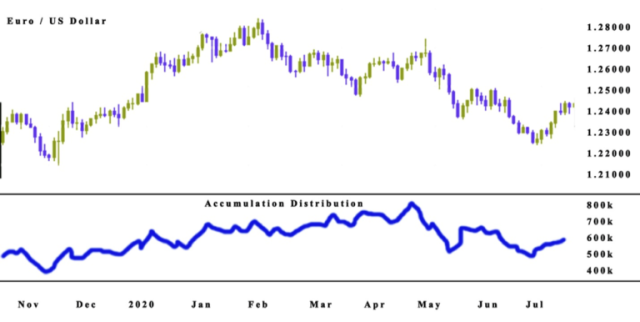
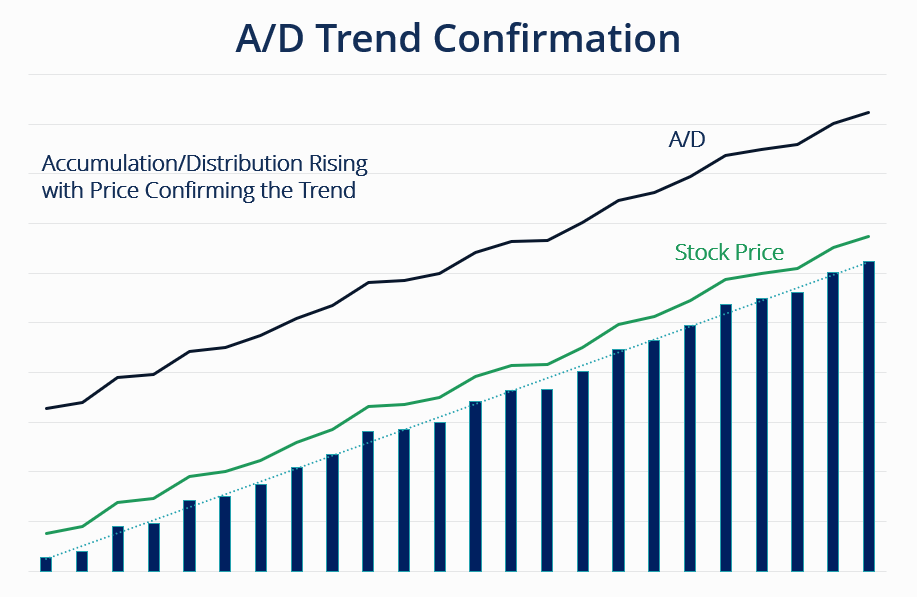
Suppose the stock price rises, but the accumulation distribution indicator falls. In that case, it implies that buying may be insufficient to support the price rise, and the price will most likely fall. A rising accumulation distribution line indicates an upward price trend, while a falling accumulation distribution line indicates a downward price trend.
Accumulation Distribution Line
The accumulation distribution line is a cumulative measure of each money flow or period's money flow volume. A high buying pressure is observed for a given period when the high positive multiplier combines with high volume, pushing the indicator higher. High selling pressure is observed for a given period when the low negative multiplier combines with high volume, pushing the indicator lower.
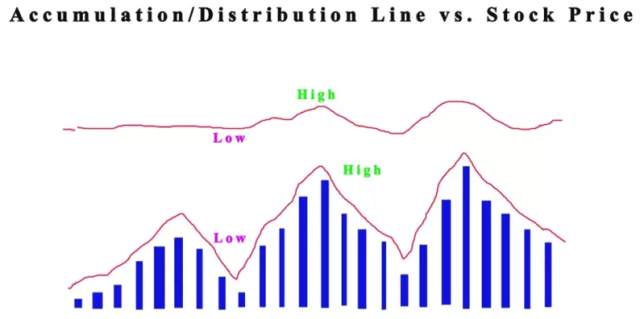
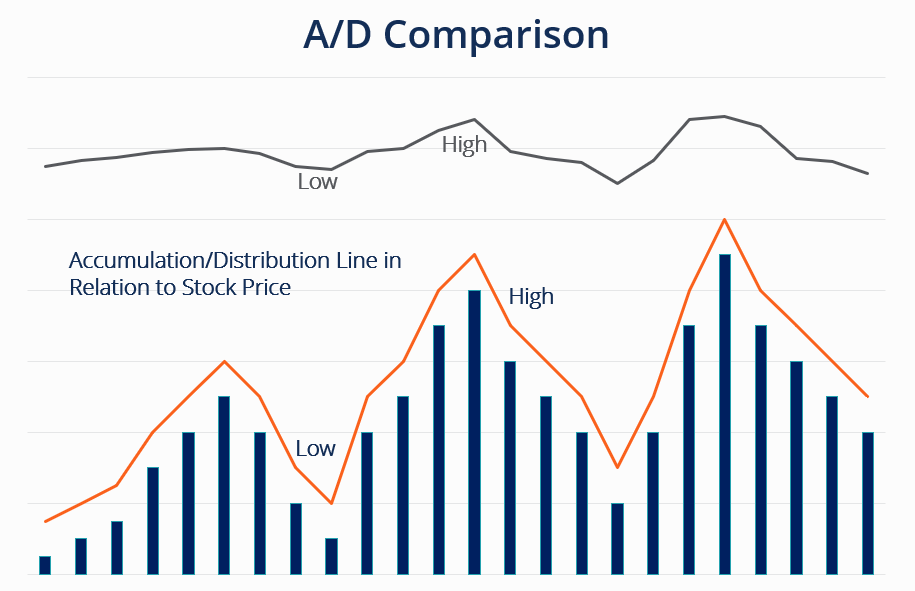
The accumulation distribution line is also used to boost the underlying trend in instances where the money flow volume accumulates to form a line that confirms or contradicts the current price trend. The accumulation distribution line also helps to show how supply and demand factors affect price moves, such that the accumulation distribution line can either move in the same direction as price changes or in the opposite direction.
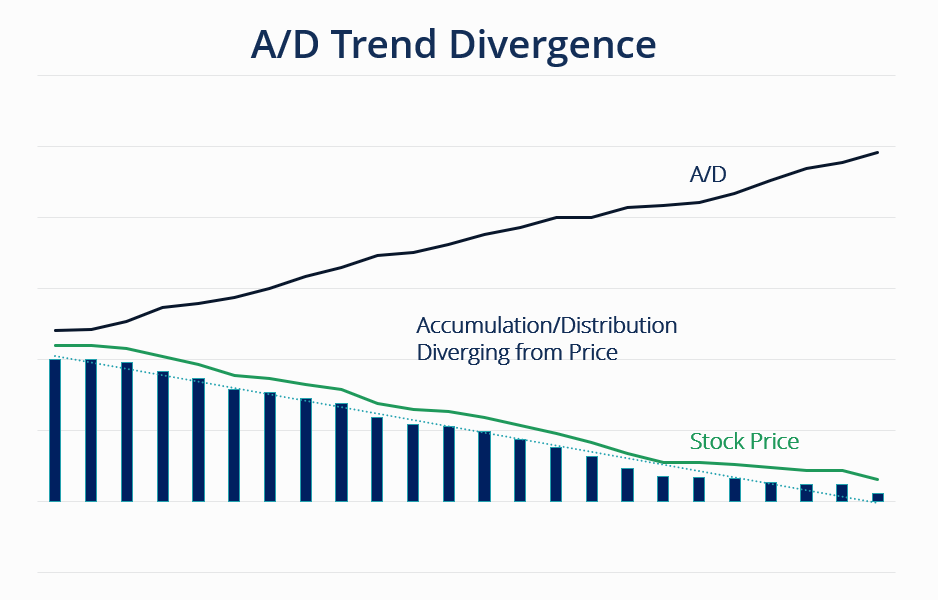
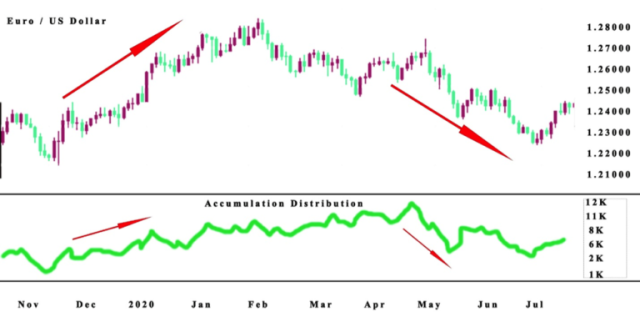
An uptrend in the accumulation distribution line indicates an underlying buying pressure, and if the price trends downwards, it can predict a bullish divergence in prices, while a downtrend in the accumulation distribution line indicates an underlying selling pressure; when the price trends upwards, this can also predict a bearish divergence in prices.
How to use the Accumulation Distribution Indicator
The primary rule of the accumulation distribution indicator is that the stock volume comes first before the stock price, which implies that the number of assets transacted is relative to the stock price movement; either it falls or rises.
Like other volume technical indicators, the accumulation distribution line indicator predicts the direction of the stock volume flow; this helps to determine the future results of price movements and helps investors predict the volume flow, which provides an almost accurate estimate of the price movements.
The essence of the accumulation distribution indicator is to assess price trends, know the direction of the accumulation distribution line and predict the buying or selling pressure behind the primary trend. The accumulation phase is signaled by the rise of an accumulation distribution line. The distribution phase is signaled by the fall of the accumulation distribution line.
If the price action is declining or falling during a trading range, and the accumulation distribution indicator is in an uptrend, it indicates a potential bullish divergence and buying pressure.
Suppose during a trading range, the price action rises, and the accumulation distribution indicator shows a downtrend. In that case, it indicates a potential bearish divergence, and selling pressure or high distribution is close by. It also means that the price may be due for a decline.
The accumulation distribution line indicator provides an insight into the price trend; if a vigorously rising accumulation distribution line confirms a high rising price, then there is much accumulation, while a vigorously falling accumulation distribution line confirms a falling price, then there is much distribution.
Combining A/D with other Indicators
Sometimes, there is a need to verify the course of a trend with other technical indicators to get an extra layer of confirmation from the data received from the accumulation distribution indicator. Using other technical indicators, investors can see a better market perception.
One of the technical indicators that you can combine with the accumulation distribution indicator is the Relative Strength Index (RSI). The combination of the RSI and the accumulation distribution line is to identify scenarios of oversold and overbought stock markets.
In addition, the Pivot Point indicator used to confirm potential support and resistance levels can be combined with the accumulation distribution line to locate possible trend reversals and divergence. Other technical indicators you can combine with the accumulation distribution line include Chaikin money flow, momentum oscillators, money flow index, Bollinger Bands, and Moving Averages, among others.
Each trading platform has a range of technical indicators that you can use to back up a trading strategy. However, technical indicators should not be used alone but with other momentum indicators as well. Investors can also test a few technical indicators to know how effective and efficient the combination will be. If it turns out great, it can be used on the market, but otherwise, you shouldn't use it.
A/D Indicator vs On-Balance Volume
The accumulation distribution indicator and the on-balance volume are cumulative indicators that use volume and price but with different approaches.
The on-balance volume considers if the current closing price is lower or higher than the previous price close. If the current close price is lower, the period's volume is subtracted, but if the current close price is higher, the period's volume is added.
The summation of the positive and negative volume forms the on-balance volume line, which is used as an indicator to verify current trends and identify potential reversals with divergence from the stock price.
The accumulation distribution indicator does not consider the previous price. Instead, it uses a money flow multiplier based on the location where the price closed within the period's range of the stock. Based on these, even though both technical indicators depend on price and volume, they involve different calculations and results.
A/D Indicator Pros and Cons
Pros
The accumulation distribution indicator is a technical tool to estimate the volume flow behind the price moves. The accumulation distribution indicator can regulate both the buying and selling pressure of stocks, and the information obtained from the chart provides an insight into the possible stock price action in the market.
The accumulation distribution indicator identifies volume and price divergence, which enables investors to identify and predict the potential of a trend. Divergences can last for a while in the market and are poor timing signals, such that when divergences occur between the indicator and the price, it doesn't imply that a reversal is imminent.
Cons
The accumulation distribution indicator does not show price fluctuations between periods, creating a situation where a few price gaps are unaccounted for. This is because the indicator does not factor in price changes between one period and another but only centers on where the price closes within one period's range.
The accumulation distribution line connects with the price movements for a period, implying a disconnect between the technical indicator and the stock price. However, one way to bridge the cons of the accumulation distribution indicator gap is to use it alongside other technical indicators like the Bollinger Bands and RSI.
Best Stock and Forex Trading Course

Asia Forex Mentor offers the best forex trading education in Asia. The course is set up so that you can earn money while learning. You'll be able to trade forex profitably with a skilled trader's help. In Singapore and other sites worldwide, tens of thousands of people from the United States, the United Kingdom, and other Asian countries have been taught.
Ezekiel Chew's teaching method is founded on the principle of return on investment, which states that if you invest $1, you will gain $3. It's not about zany strategies or elaborate procedures. Professional traders and financial organizations use his authorized system. He is the driving force behind the growth of various companies, including DBP, the Philippines' second-largest state-owned corporation.
Due to his strategy's effectiveness, many full-time traders have joined the program with little to no prior trading experience and emerged successful.


Best Stock Brokers


Conclusion: Accumulation Distribution Indicator
The accumulation distribution indicator is a volume-based technical indicator that uses the divergence between the volume flow and the stock price to determine the stock trend in the market. It is not a complex technical analysis tool, provided investors are ready to correctly implement the results from the price chart to monitor the stock price and the period's money flow volume.
One of the main objectives of the accumulation distribution indicator is to know when to accumulate and distribute stocks. An uptrend indicates that there is buying pressure, while a downtrend indicates that there is selling pressure. The price trend signals help investors predict the market dynamics, which allows them to take the correct positions in the market.
It is best to not use the accumulation distribution indicator as a standalone indicator because of its limitations and cons and, most importantly, to confirm further that the data from the indicator is an accurate result. I hope this article will guide you as an investor to identify the potential price trends as you apply the accumulation distribution indicator to make more profits in your trade.
Before you make any investment decisions, seek investment advice from your financial advisors to understand the risks involved.
Accumulation Distribution Indicator FAQs
How do you identify stock accumulation and distribution?
The accumulation distribution indicator compares the closeness of the closing prices to the high and low peaks to determine if the current trend of the market is the accumulation or distribution of stocks. Compared with the closing price at both ends, it indicates the present state of stocks in the market.
How do you identify accumulation and distribution phases?
During the accumulation phase, sellers sustain the stock prices at higher bids until the stocks are sold, while the distribution phase begins as the markup stage ends. The price action moves into another period's range.

