
In the world of financial markets, many strategies are used to achieve the most profitable trade. However, these strategies are simply ways to make price predictions based on chart patterns. Among many charts are the Open High Low Close price chart (OHLC), which is commonly used by financial analysts.
To understand the effectiveness of OHLC charts we've got Ezekiel Chew who is head of the Asia Forex Mentor training platform and a component and successful forex trader. According to Ezekiel, the OHLC chart represents four price action positions within a time frame that is the open price, high price, low price, and close price action. For this reason, OHLC charts are used mostly in technical analysis for examining the market volatility, as it depicts all four crucial price points in a bar chart.
In this review, we will discuss the use and importance of OHLC charts. Moreover, traders can also learn about how OHLC charts can be read and used for assessing the price momentum. Hence, this review will be the ultimate guide for readers to OHLC charts inside and out.
What is OHLC Chart
The open, high, low, and closing price bar chart is a graphical representation of asset price momentums for a certain time frame. The predominant aspect of OHLC charts is that it provides a range of data to the traders regarding the prices. From opening to closing price, traders can assess the price movement of an asset within any trading period. Similarly, the high and low price bar helps traders to predict market fluctuations.
There is no restricted time frame for OHLC chart patterns. Technical analysts and day traders can use OHLC as a daily chart for day trading or use it to evaluate the monthly or yearly price movements. As a result, OHLC charts enable traders to view the past performance of an asset so that future investment decisions can be made.
OHLC is the most common and favorable price chart that is used amongst day traders and analysts alike. Moreover, bar charts and candlestick charts are the popular chart type of OHLC patterns that are the simplest yet most effective tools to evaluate trading transactions.
Regardless of the importance of OHLC charts, these are just tools that cannot be effective unless they are used in combination with other trading methods and strategies.
OHLC Bar Layout Explained
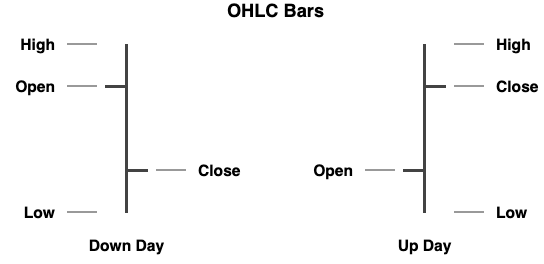
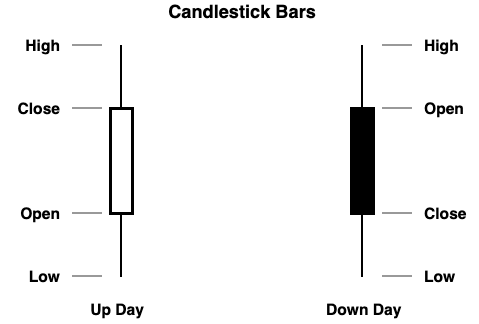
The OHLC layout is the simplest representation of price movement which can be easily interpreted even by a new trader. Commonly candlestick charts and bar charts are used in the OHLC layout which comprises a horizontal line and a vertical line.
The horizontal line at the Y-axis illustrates the opening price and closing price at each end. The open price action means the price at which an asset starts trading in a particular period. Whereas the closing price is at the other end of the Y-axis which is where the price movement stops for the given time period.
Closing price are considered to be the most crucial data indicator regarding price movement predictions. Retail traders and investors both are interested in assessing the closing price of an underlying asset so that they can make profitable investments.
Moreover, the distance between the opening and closing price also indicates the stable or unsteady movement of the prices. Consequently, the short distance between the opening and closing price is considered a feeble price action whereas a long distance ensures a strong price position of the asset.
On the X axis, the high and low prices are reflected which are easy to read. It is depicted in a vertical line at which the lowest price starts and moves towards the higher price action. This vertical line helps traders to evaluate the range of market volatility enabling them to make profitable investment decisions.
How to Interpret an OHLC Chart
Almost all forex brokers offer forex charting software to their customers. There are numerous options to choose from so traders can select any chart type or pattern which suits their trading needs. However, OHLC is one chart pattern that is preferred by many traders due to its wide range of technical indicators and price actions.
OHLC charts are interpreted in multiple ways by technical analysts. At first, there is the vertical line which represents the price fluctuations in the market. If this line is longer it signals that there is a lot of volatility in the market which indicates to halt in investments.
The horizontal line, on the other hand, shows the high and low prices at both ends. This line helps traders to figure out if the price of an asset is moving from low to high which suggests that the asset is being bought more. Conversely, the movement from high price to low reveals that the asset is not selling much in the market. A stable line shows that there is indecisiveness among traders for the asset.
The bar colors in the OHLC chart show the upward and downward trends. The black bars indicate an upward trendline whereas the red bars are used for a downward trendline. This clear visual differentiation makes it very easy for traders to examine the market trends at a glance.
Additionally, there are also patterns on OHLC charts that serve as market analysis indicators. These patterns include inside bars, outside bars, and key reversals. These patterns help in identifying the upside and downside trends and also give the sign for any expected price rebounds.
All in all each component of an OHLC chart ensures successful trading transactions for the investors and helps in hedging against any potential investment risks.
OHLC Bar Charts vs Candlestick Charts
OHLC charts are available on forex charting software on various brokerage platforms. These charts are offered in multiple forms. However, the most common types of OHLC charts that are preferred by technical analysts and traders are bar charts and candlestick charts.
Both OHLC bar charts and candlestick charts have some aspects in common and they are different from each other in other dimensions. However, both these charts are in contrast with the line charts which provide very limited information but still are used in some market data assessments.
The OHLC bar charts, as the name suggests represent price action graphically in the form of bars. These bars can be read by looking at the left and right of the horizontal lines which signals the open and close price of an asset. Whereas candlestick charts have a black and red candle shape image that represents the open and closing price.
Both candlesticks and bar charts provide the same amount of relevant information to the traders. Starting from the opening price to the closing and high and low market trend. There are more common aspects between the two charts than any major differences.
Best Forex Trading Course

The world of forex is enticing for many individuals. As a result, everyone wants to try their luck in the forex market hoping to earn massive profits in a short time. As incredible as this may sound, there is no denial of the wide monetary scope of the forex market for experienced investors as well as new traders.
However, all the high ambitions in the forex market are only possible if a trader or investor has the guidance and supervision of a financial expert. Individuals need expertise at every step to make the right investment decisions and use the most effective investment strategies to achieve the desired results.
In this regard, the Asia forex Mentor is an online platform that has proved its worth by training uncountable individuals to make significant six-figure profits in forex trading. The AFM is a forum that provides a comprehensive one-core program for newly entered day traders to experienced investors. For this reason, the one core program offers a range of courses from the very basic to highly advanced levels.
The best part about AFM's one core program is that it trains traders into learning trading through methods such as mathematical probability. This allows the traders to learn a fixed pattern of successful trading so they can make profits in each trade.
In short, anyone who is looking for the best place to learn forex trading with some authenticity should opt for the AFM one core program. The credibility of this platform can be assessed through the numerous reviews from investors, banks, and individuals from other financial institutions across the globe.


Best Forex Broker
Conclusion: OHLC Chart
Day traders or investors who are aiming for profitable returns in their trading transactions go to financial experts for technical assistance. In turn, these analysts need the support of effective investment strategies and tools for productive financial counseling. For this reason, different trading methods, strategies, and tools are considered to be vital for substantial capital gains in the financial markets.
Among these tools trading charts also holds great importance in technical analysis. These charts offer a glance at various price positions and give an overall view of the market through a graphical representation. Consequently, financial experts and brokers always rely on these charts for investment advice and decisions.
Many chart patterns are used in the financial markets. Among these charts is the OHLC chart type which is quite popular and mostly used by analysts, investors, and, retail traders alike. The full form of OHLC is the open high low close, and it offers a wide range view of an asset's price actions and market situations.
An OHLC chart shows the opening and closing prices in a horizontal line as well as the high and low prices in a vertical line simultaneously. This makes it very easier for traders to analyze the market situation and the asset's position so that they can make investment decisions accordingly.
There are many types of OHLC chart patterns however the most commonly used are the OHLC bar charts and candlestick charts. These types are almost similar to each other in the information it shows regarding the asset's price action but is different in their shapes in the chart representation.
All in all OHLC charts is an important element in the overall financial trading process. The significance of the OHLC charts cannot be neglected as it is a crucial ingredients for successful trading.
OHLC Chart FAQs
What is the OHLC Strategy?
The OHLC strategy is used by financial experts, investors, and traders to make investment decisions using the OHLC charts. These charts describe the wide range of market positions and an asset's price action to the analysts. On the OHLC charts the opening, closing, and high and low prices of an asset can be evaluated.
For example, a trader looking at an asset that has opened high can make the decision of selling the asset. This would be produced keeping in mind the chart analysis with the expectations of the low closing prices in the near future.
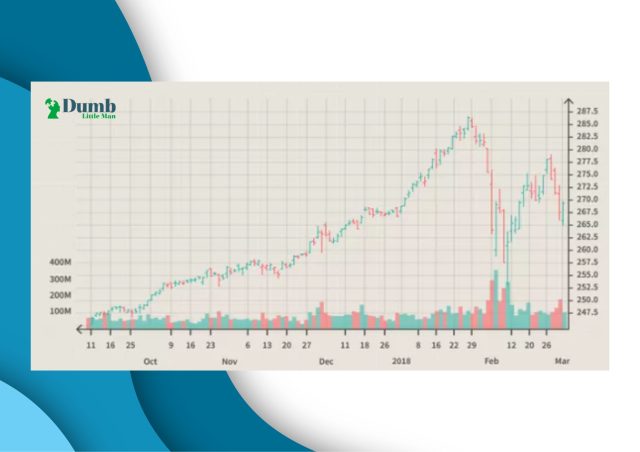
What is the Volume in OHLC?
In the OHLC chart, there are horizontal and vertical lines that, represent the open, high, low, and closing prices of an asset. However, at the very bottom of the chart are green and red bards which highlight the trading volume.
As volume means in simple terms the intensity of any action or thing. So in this case the volume in OHLC graphs indicates the intensity of the high low and open and close price action of an asset within the given timeframe. Moreover, the volume also assists in analyzing the importance of price fluctuation in investment decisions.
Hence, if the volume of the intensity of any underlying asset is low then the investors are probably expecting a high price and would not be in a position to buy the asset. In contrast, if the volume of a security's price action is high then i is considered an ideal long position for investors and traders.


