
Want to jump straight to the answer? The best forex brokers for traders are Avatrade and FXCC
The #1 Forex Trading Course is Asia Forex Mentor
Becoming a successful investor and getting that positive money flow that you want is not simple. The problem with many beginners is that they often try to learn everything about forex trading within a week or two. This is not tenable and as such, you may end up glossing past important indicators, including the money flow index.
Now, there are many indicators in the forex market. But this post will solely focus on the money flow index indicator and how it can help you determine a typical price and volume data of an asset.
Also, this post will largely be based on the approach of Ezekiel Chew, one of the most revered forex educators and traders in the world. If you want to learn about how markets oscillate and how capital flows in and out of assets, this is the post for you.
What is Money Flow Index
The money flow index is a forex trading indicator used to determine the flow of capital into an asset over a specific time. The money flow index MFI incorporates volume-weighted rsi and other factors to indicate market momentum. It helps investors know if the market is at overbought and oversold levels.
Typically, the money flow index MFI indicator comes with a score. The score ranges from 0 – 100. A score above 80 indicates that the market is overbought. On the other hand, a reading of below 20 suggests that the market is oversold. Now, overbought and oversold levels are crucial when you are deciding the most ideal entry position in a trade.
You can use these indicators to determine the money ratio you want to use. However, please note that the money flow index MFI indicator is not used in isolation. It is just a tool or indicator that helps to determine either negative money flow or positive money flow. As such, it is best to use it in conjunction with other tools as well.
Why Traders should use Money Flow Index
The money flow index MFI is used as a momentum oscillator. In other words, it can help a trader determine if trend reversals in the direction of a given asset are coming. Also, these tools are used to determine overall sentiment with regard to a certain asset. Let's take an example of a currency pair.
If the money flow index MFI for example shows that that asset is oversold, it suggests that the overall market trend for it is bearish. This is known as a bearish money flow index MFI. On the flip side, if an asset is overbought, it suggests that sentiment around it is positive. This is known as the bullish money flow index MFI.
Now, if a market is overbought, a reversal will happen if the price falls. So as an investor, you can bet that since buying pressure has persisted for some time, at some point investors will cash out and start to sell. The period's typical price reversals can happen anytime. Additionally, if the market is oversold, it suggests that downside pressure is high. Again, there will be an opportunity for selling pressure to reverse.
Buying and selling pressure is common and raw money flow can help you know when each pressure will ease. If you time it right, you can make a lot of money. Please note however that money flow index scans and negative money flows are not enough to gauge momentum. You may need a set of momentum oscillator indicators including the relative strength index as well.
The Typical Price is Calculated
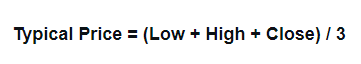
Now that you know what is considered negative money flow and what is considered positive money flow, the next thing is to learn how to calculate the typical price. So, normally, this price is often the average of the lowest price over a given time, the highest price at the same period, and the closing price.
Please also note that the typical price is not enough. You also need to know the raw money flow to determine buying pressure and selling pressure. The raw money flow is calculated by multiplying the typical price by the trade volume.
This will more or less give you volume leads prices that will eventually make it easier to predict the price reversal and the price action. Also, you don't actually need to do this calculation on your own. There are many advanced technical analysis tools that can help you get these indicators and the total money flow in the long run.
The Positive Money Flow and Negative Money Flow are Calculated

The raw money flow is a great indicator of negative money flow and positive money flow. So, if the typical price is higher than the previous price in the session, it means that we have a negative flow.
But if the price is lower than the previous price, this is considered a positive flow. Unless there are price extremes in the market, these indicators can help predict many things including an upcoming upward trend, bearish divergence, failure swings, and others.
The Money Flow Ratio is Calculated
The next thing to talk about is the money ratio. The money ratio is calculated from the negative and positive money flows. So to do this, take the positive money flow over a 14-day period and divide it with the negative flow over the same 14-day period.
That gives you the ratio. This data can contribute to your analysis to identify overbought and oversold levels. You can also use it to predict a fast price rise and today's typical price as well.
Calculate the Money Flow Index
Once the money ratio is in, you have enough now to calculate the money flow index and finally use it as an indicator of oversold and overbought levels. Money Flow Index = 100 – 100/1+money flow ratio.
The index returns positive if the price of the asset under question has risen over 14 days. It indicates there is buying pressure in the market. If the index returns a negative figure, it means the price has dropped in the 14 days. This will be a sign of selling pressures.
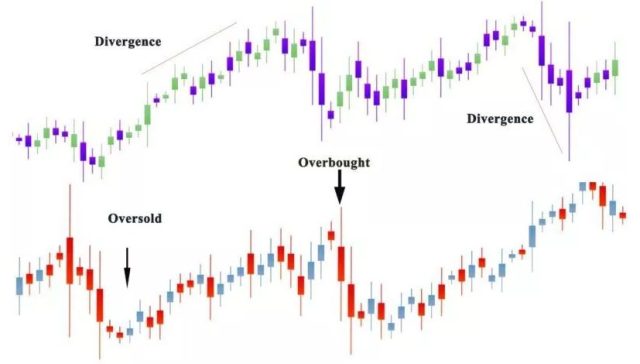
Money Flow Index Signals
On average, there are three main money flow index signals. They all have a big difference and are used by market experts. Please also note that the money flow index requires a lot of supporting data. Nonetheless, the first of the three signals is known as the overbought/oversold conditions.
If a security or asset shows a sharp and rapid price increase to the highest level, it is considered overbought. On the reverse, if the asset shows a sharp price decline, then it is considered oversold. A strong downward trend will typically make the price move lower for the underlying security.
The other two indicators are failure swings and divergence. All measure the rapid decline in today's price or the rapid rise. When you are day trading or even live trading, it is very important to use these three indicators together. For example, if an asset is in truly oversold condition or truly overbought condition, make a point of checking out the other two technical indicators before you buy or sell.
Best Forex Trading Course

There is no doubt all these things may seem a bit technical to follow. In fact, the price makes so many wild swings each day that it can be very hard to measure buying pressure or selling signals. Also, learning all the technical analysis you need for forex takes more than just a day. Instead of relying on the odd article here and there, you may want to get a full detailed course to take you through all these situations.
Here is where the idea of the Asia Forex Mentor by Ezekiel Chew comes in. The course is a robust introductory guide that will give you the knowledge you need to trade forex. It's a beginner-friendly guide as well that works for folks who want to trade forex and any other financial asset.
The Asia Forex Mentor will not just teach you how to predict price shifts, daily volume, and these other technical indicators. It will also teach you how to manage capital and explore some of the most advanced risk control measures in the world. After all, as long as you are managing your capital correctly, identifying overbought and oversold pairs will be the easier part.
Also, if you are an advanced trader looking to learn some of the tricks used by leading banks, this course is also ideal. As a matter of fact, The Asia Forex Mentor is developed by someone who has taught some of the leading investment bankers how to trade forex. You will be able to identify a losing trade, gauge price movement under immense trading pressure, and maintain a level head even when the markets are volatile.


Best Forex Brokers
Conclusion: Money Flow Index
Forex trading is not a predictable market. It is one of the most volatile and liquid markets in the world. But there are a few tools that you can use to remove the gambling out of trading and bring in some semblance of structure. The difference between the best traders and the rest is not that they know everything. But they have the presence of mind to use the tools at their disposal to make informed trading decisions.
The money flow index is designed to be one of these tools. It will help you use yesterday's typical price to assess where an asset is probably going and how to play it. At the end of the day, if you can bring probability to your side, then you have a better chance of making money in forex.
The ultimate goal though is to know how the money flow index works within a collective strategy. You cannot use these tools in isolation. They need to be put together within a set. That way, you are likely to get a broader picture of the market without any issues.
Finally, no matter what tool, sell signal, or indicator you use in trading forex, you must also use proper capital control. How you manage capital will determine if indeed you will be a success or not. In fact, the first thing you learn even before you reach these trading strategies is how to manage risk.
Money Flow Index FAQs
Which is better, MFI or RSI?
As noted above, there is no single tool in forex that is better than the other. The most important thing is to use these tools as part of a broader strategy. Nonetheless, both the MFI and RSI are used as momentum indicators. In other words, they are used to determine the direction of the market based on trade volume, momentum, and other factors.
Is MFI a leading Indicator?
Yes, the MFI or money flow index is one of the most commonly used indicators in forex. It is used by technical analysis experts even in other assets as well. Over the years, the MFI has in fact proved to be a very useful tool in enhancing trading probability. While it is not used on its own, it still has massive significance in influencing the type of strategy that people take.

