
Any investment market moves in cycles; a rising momentum provides an excellent opportunity to buy the asset and see your portfolio rising. However, a falling momentum suggests a shorting possibility that can convert your investments into profits. The McClellan oscillator is a popular momentum indicator used by experts around the world.
Momentum indicators detect cycles on the price action graphs, which are used to judge the demand and supply of an asset. A falling price in a declining market is a sign of high supply by investors, and a rising price would mean otherwise.
Accurate knowledge about technical indicators can come in handy to make the right decisions. Are you looking to profit from momentum trading? If yes, then this article is for you.
We shall talk about the McClellan oscillator, how it is used and whether it's a good choice. We have Ezekiel Chew with us to share his take on the subject. He is a renowned mentor who has helped thousands of students learn asset trading and make consistent returns per trade. Let's use knowledge for our benefit.
What is McClellan Oscillator
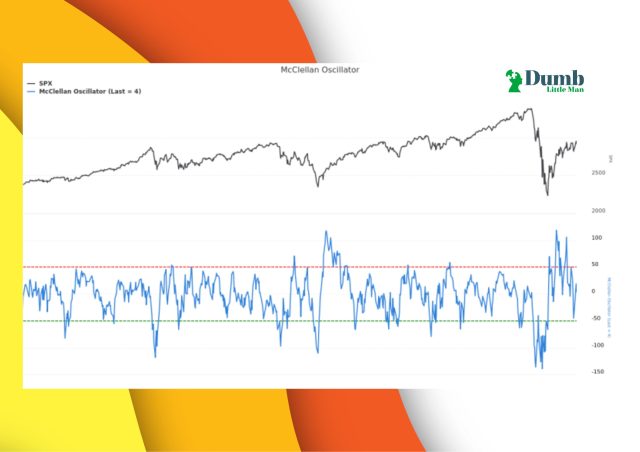
A market breadth indicator measures the strength of a market index; it measures the number of advancing shares to those with declines. They show the market trend and how the market index is progressing. A popular type of breadth indicator is the McClellan oscillator; it compares the number of advancing issues against declining ones.
A McClellan oscillator is used for cumulative indices representing a combined view of the market; experts use the market breadth oscillators for NYSE and NASDAQ exchanges. The oscillator's movement highlights whether shares and securities are being overbought or oversold.
If the indexes are moving positively, but the oscillator has started declining, it signals an upcoming decline, and shareholders should begin looking for a way out.
The McClellan oscillator was developed in 1969 by a couple named Sherman and Marian McClellan. The goal of the oscillator was to predict the market momentum of certain indexes; it highlighted strong shifts-breath thrusts- in market sentiments that allowed traders to determine the future movement and plan their strategy.
How to Trade using McClellan Oscillator
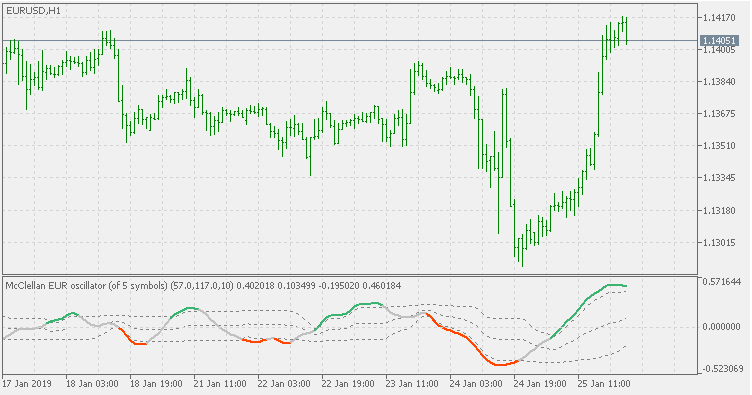
The market breadth indicator-based oscillator is a key to detecting movements in indexes; unlike other indicators, the oscillator isn't designed to deal with a single stock or security; instead, it is used to adjust the exchange movements, and the value is compared against other exchanges. You would note by analyzing its calculations that the McClellan oscillator is highly dependent upon the short and long-term exponential moving averages, making it similar to MACD.
A short-term moving average represents a 19-day EMA of net advances, while the long-term moving average is based on a 39-day EMA. The graphs picture the difference between the two EMA; once the value of the short-term EMA crosses the long-term EMA, the McClellan oscillator line crosses the zero line and highlights a positive investor sentiment.
Similarly, if the 39-day EMA is less than the 19-day EMA, it suggests a higher supply of assets than the ongoing demand, signaling an upcoming decline in the indicator.
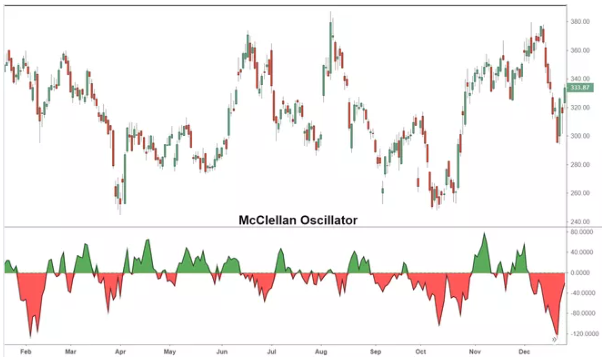
The goal of a trader is to determine the ongoing market conditions and judge whether a bearish or bullish trend may come next. The McClellan oscillator uses red and green lines to provide insights into investor sentiments and market conditions.
A green line suggests that investors in the exchange are buying more assets in the hope of a future rise; it presents a bullish trend and contains a buy signal for investors.
On the contrary, the red line shows a bearish trend; once the overbought and oversold levels alter and the 39-day EMA turns more than the 19-day EMA, the oscillator line crosses the zero line and turns red. It shows that investors are readily supplying their shares, and prices are expected to decline further, indicating a sales signal.
The McClellan oscillator has been a popular choice amongst traders in the New York stock exchange; they find it easy to detect upcoming market trends and make good decisions. Breadth Thrusts are an essential aspect of the McClellan oscillator and highlight substantial shifts in an index.
Usually, breadth thrusts involve a movement of more than 100 points; for instance, a standard breadth thrust would involve a point movement from -50 points to more than +50 points. The firm shifts signal the upcoming strong bullish trend, and it signals the traders to buy more shares in the hope of churning for profits later.
However, sometimes a breadth thrust may give false signals and signify persistent low prices of shares. A reliable interpretation can be derived using bullish divergence when interpreting breadth thrusts. A bullish divergence involves a rapid movement from negative to positive territory, and if they precede a thrust, it can be a good buy signal.
However, reliance on a single indicator is never recommended, and you must pay attention to other momentum indicators, such as the relative strength index, to get confirmation about index movements and make profitable decisions.
How to Calculate McClellan Oscillator

The McClellan oscillator has been an essential indicator for swing traders; it helps them identify the shifts in market sentiments, and they can appropriately make their trades.
However, if a trader doesn't understand the background calculations of an indicator, they are bound to commit mistakes and misinterpret signals. Fortunately, understanding the McClellan oscillator is easier than most traders think. Let's start with the equation.
McClellan oscillator= (19-day EMA of advances – declines) – (39-day EMA of advances – declines)
EMA refers to the exponential moving average. The 19-day EMA is calculated by subtracting today's advances from the declines and multiplying the value by 0.10. Further, the outcome is added to the previous day's EMA. The 39-day EMA uses the same difference between advances and declines, but the value is multiplied by 0.05. Next, the outcome is added to the previous day's EMA.
Once you have the EMA values, you can insert them into the equation and get the value for the McClellan oscillator. However, a single value can't be used to draw any conclusion, and you would need to repeat the same process for the last day's oscillator value. The net advances will change, but the equation stays constant.
McClellan Oscillator vs. McClellan Summation Index
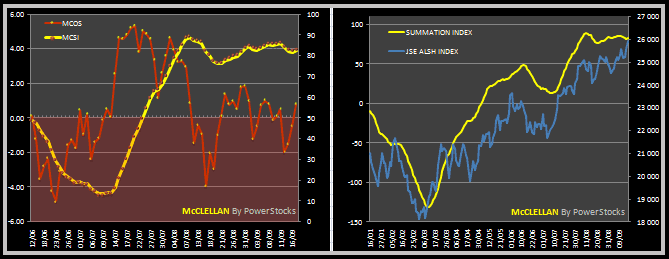
The founders of the McClellan oscillator also produced another index to determine market trends for long-run traders- it is known as the Mcclellan summation index and is published alongside its counterpart in McClellan financial publications.
The Mcclellan summation index adds the value of the Mcclellan oscillator over a period. It sums today's McClellan oscillator to the previous day's total to create a cumulative measure of market strength and movement. Usually, the summation index used to hover around +2000, but the increase in shares has disturbed the overbought and oversold levels, making a difference in the index.
A strong bull index on the summation index is detected when the index reaches a value of +1900 after a shift of more than 3600 points; it presents an attractive opportunity to invest in the market and generate positive returns.
The difference between the two indicators is the timeframe; while the McClellan oscillator is a good choice for swing traders, the Mcclellan summation index is more suited to long-term traders that don't base decisions on daily values.
Best Forex Trading Course

Mcclellan oscillator is an exciting subject, and it opens a new trader to various other technical indicators that identify the systematic movements of the markets. The importance of technical analysis can't be denied in any investment; it opens up newbies to an instant realization of crafting better strategies and redefining optimized plans.
However, newbies often struggle to find the best educational resource to learn about investments; there are various courses, and it gets difficult to differentiate between them when everyone's claiming to be the best. Asia Forex Mentor is our choice; it is a detailed course about the Forex market that caters to the needs of every trading segment.
The course is distributed into five phases; each phase provides an essential resource to the viewer and gives them actionable plans that can be executed to improve their portfolio. The information is backed by mathematical probability, and all indicators are back-tested on historical data for accuracy.
However, you would still wonder why it's the best choice. The best answer is the coach who made the course; Ezekiel Chew is one of the most famous digital investment coaches, and he has helped thousands of investors enter the forex world and make six figures reliably per trade.
His teaching technique is unique and highly regarded by financial experts worldwide. The renowned tutor not only teaches individuals but is also a trainer for various financial institutions and brokerages. DBP- the second largest bank in the Philippines- is one of his popular trainees. The official website shows numerous examples of excellent results achieved by the tutor and his trainees.


Best Forex Broker
Conclusion: McClellan Oscillator
After our above discussion, you might have understood how the McClellan oscillator works and its advantages in simplifying your trades. However, like every indicator, the McClellan oscillator has some limitations that must not be ignored. The oscillator provides multiple signals in a short span.
Some of the signals may be false and can result in significant losses. The best way to rectify the wrong signal is by using the oscillator alongside other indicators and price graph analysis. You must verify the insights from the McClellan oscillator by confirming them through other indicators.
Any investment market can be a rough ground for traders, and unprepared traders bring the most considerable losses. The best way to curb your losses is to be well aware of market dynamics and how risk could be minimized. Technical education is irreplaceable, and you must use the available resources to understand market movements and developments.
McClellan Oscillator FAQs
Is using the McClellan Indicator profitable?
The McClellan oscillator provides an easy opportunity for swing traders to determine market sentiments and make profitable decisions. You can use the oscillator to predict index strength and divergences. However, the McClellan oscillator gives multiple signals within a short span, and it is rare for all of them to turn positive.
The index is pretty prone to false signals, and if you use it without a supporting indicator, you may end up in an unwanted situation. Nonetheless, the right strategy can help you attain excellent results in a short time.
What does the McClellan Oscillator Measure?
A McClellan oscillator is a breadth indicator derived by comparing the number of advances and declines in exchange; it is calculated by differentiating a 19-day moving average with a 39-day EMA. Both the EMAs are calculated by differentiating the advances against the declines.
A positive value suggests a rising oscillator pattern that is a buy signal for traders. A negative value indicates the opposite (Sell signal). However, traders must be aware of false signals and avoid using breadth thrusts as the sole decider of a crucial decision.
What is the McClellan summation Index?
The McClellan summation index was published alongside the McClellan oscillator in the McClellan financial publications. The summation index measures the cumulative total of the McClellan oscillator; its value represents the sum of the oscillator's value over a period.
Experts use the summation index to plan their long-term decisions; historically, a 3600-point movement on the positive side signals a bullish divergence, and markets can be expected to move in the positive direction.

