
Want to jump straight to the answer? The best forex broker for traders is Avatrade
The #1 Forex Trading Course is Asia Forex Mentor
Elliot Waves – Quick Setup Tutorial
Trading requires a keen analysis of price action. And traders who take time to read the markets have a better score at making trades that are highly consistent with regard to profitability. Therefore, part of price analysis involves using technical analysis tools like the Elliott wave, which derives insights from Fibonacci ratios or Fibonacci sequence.
Elliot Waves requires a keen eye to help confirm the expectations of price waves. And trading the opportunities with good money and risk management approaches. Overall, the Elliott wave is not a guarantee to profit. And will require trading the strategy with market forecasting, plus a blend of other indicators that have the ability to raise affirmative and contrary signals appropriately.
While reading the waves on a price chart gives high predictive insights, it may not be the case for a new trader. However, as they gain expertise along the way, the importance of Elliott wave analysis becomes a core part of market analysis.
In this post, we’ll seek the Expert indulgence of Ezekiel Chew – a lead trainer mentor with Asia Forex Mentor, to share an expert's explanation about the Elliott wave. He gives back to society by sharing insightful analyses of the markets and also sits in globally acknowledged forums on the thematic area of trading the financial markets.
Later on in the post, Ezekiel will share a practical application of a strategy taking trades by relying on the Elliott wave theory. The results will cover market diverse trading assets and target to measure three metrics with the strategy: Profitability, Risk rewards ratio, and the winning rates of the strategy.
What is the Elliott Wave Theory?

Elliott Wave is a theory of technical analysis that seeks to predict the movements of prices in the wave structures. Inferences from the theory point out that Ralph Nelson Elliott discovered a key nature with prices: the recurrence of never-ending patterns. Apart from prices in financial markets, the fractal nature of wave analysis shows up in consumer behaviors.
Therefore, the Elliott Waves concept intertwines in market prices as well as market-consumer behaviors. Let’s take, for instance, if mortgages reduce in cost of capital, lenders will notice a shift. As a result, mortgage refinancing will spike up as parties seek to benefit from new contracts at lower interest rates. And experts point to such consumer shifts as -riding the mortgage refinancing wave.
Traders who use technical analysis to work with Elliott wave have to approach the concept with a long-term view of the prices. More so, within the scopes of the investor's psychology and changes in market sentiments.
Under ordinary circumstances, the Elliott wave theory in technical analysis affirms that prices take two forms. And the forms are the constituents of the pattern that arises therefrom -impulse and corrective waves. Therefore, prices trace an initial pattern – the motive phase. Subsequently, the prices trace the formation of corrective waves that run in opposition to the initial waves.
The sub-sets of waves in the Elliott wave pattern conform to either of the main waves. As such, the fitting must fall within either impulse or corrective. And it’s in the light of these concepts that arise the nation -fractal or repetitive approach to investments.
Basics of Elliot Waves Theory

According to the Elliot Waves theory, traders have to understand that the Elliott wave cycle in markets behaves in two key waves or phases (Elliott wave structure). The first one is the motive phase, and the second one is the corrective phase (impulsive and corrective waves).
The motive phase is further broken down into 5 sub-waves by Elliott wave analysts. And each of the sub-waves can be distinguished from the others and given the label numbers 1 to 5. Here is a breakdown of the 5 sub-waves in the motive phase of the Elliot waves:
5 Sub-Waves of a Motive Phase in an Elliott Wave
Here are the 5 Elliott wave principle waves through technical analysis for the Motive phase
- Wave 1 marks the start of a new market trend (impulse waves)
- Wave 2 acts as a retracement of Wave number 1. Traders should make note that the retracement never exceeds the100% of Wave1
- Wave 3 takes the form of a projection of impulse waves after wave 2. Traders should take note that wave three is typically the longest when you compare it with any of the 5 waves in the motive phase. And more keenly, the wave also travels further than wave number1
- Wave 4 takes the form of a retracement of Wave number 3. On a specific note, it must trace or exceed 100% of wave number 3. This is where most average investors finally buy
- Wave 5 is the last portion of the motive phase. It’s usually a projection of wave number 4. Usually, it extends beyond the extreme limit of wave 3 or may also take on a truncation
3 Sub-Waves of the Corrective Waves or Phase in an Elliott Wave patterns
First, the corrective waves or impulse wave of an Elliot wave comprises three impulse waves correction or a three-wave pattern. And to help create a distinction between them and those in the Motive phase, we use the alphabetical letters: a, b, and c for the corrective wave.
Here are the 3 Elliott wave principle waves via technical analysis for the corrective phase
#1. First is wave a or first impulse wave. It’s the initial wave in the corrective waves or phase. Corrective waves start and move in the opposite direction of the entire motive phase or trend (corrective wave).
#2. The second is wave b, which is normally a retracement of waves a and c (corrective wave or impulse wave).
#3. However, it’s good to emphasize that the corrective wave or impulse wave arises in two common styles. First, it can appear as a sharp reversal. Secondly, it can take a sideways form. Some traders may want to refer to the sideways as an alternation. The main reason for that is the fact that resistance arises from one focal point – which is the larger trend.
Of most importance to take note regarding the corrective waves or impulse waves – they never appear in 5 waves. This is a generalist rule with corrections.
In the form of a summary, an Elliott wave principle (Elliott wave cycle) comprises the two phases – Motive and corrective waves. A motive phase has 5 clear sub-waves. A correction phase has 3 distinct phases of which the last two may appear in two forms: either as a sharp reversal or as an alternate or sideways fashion, and in opposition to the motive phase.
Advanced Elliott Wave Theory

As part of this section, we’ll cover the complex trading strategies with Elliot waves. These are part of classical technical analysis. And the strategies target the entire phases of the Elliott waves – the motive and the corrective waves. However, most of the opportunities arise within the impulses of the motive phase and they often have extensions – which are elongations containing exaggerations within the subdivisions.
Technical analysts lay emphasis on the formation of extensions in a motive phase that takes the form of three key impulses: 1 of the 3. Also, when it comes to the finer details of an extension, it helps traders with insightful hints regarding the probable expanse of upcoming waves in terms of the length.
Also, given that the impulses take place within an extension in the form of 1 among the 3 impulses, it, therefore, serves as an insightful guide. If we take an example, supposing the wave 1 and 3 are equal in their lengths, then most probably, the Wave 5 is very highly likely to be an extended one.
As part of the advanced Elliot waves, it’s also common to find diagonals occurring in the motive phase as well. However, the diagonals in the motive phase should not be mistaken for impulses. However, they usually appear as a structure comprising 5 waves, which must align to the main trends. And more keenly, with diagonals, wave number 4 will always project into the price territory of wave 1- or better refer to that in simplistic terms as overlapping into wave 1.
And still making attempts to create a vivid distinction of the diagonals appearing within the motive – diagonals take the formations of 3 wave subdivisions. The w-wave subdivisions form an overall count of three-five times or 3-3-3-3-3.
If you analyze diagonals deeper, you’ll notice that they appear in two kinds. One type comprises the Leading diagonals. And the second type comprises the Ending diagonals. In that order, the ending diagonals appear in impulse 5 of the motive phase. And the Leading diagonals occurrence is within the first impulse wave within a motive phase of Elliot waves.
Three Wave Structures or Patterns Within Corrective Elliot Wave Patterns
Technical analysts show that 3 patterns appear in the corrective phases of the Elliott Wave patterns are flats, zigzags, and triangles.
- First is the flats, and it forms the structure 3-3-5
- Second, are the zigzags which form the structure of 5-3-5
- Third and last is the triangle, it forms the structure of 3-3-3-3-3 wave counts
Most often, you’ll find the combination in the occurrence of the flats, zigzags, and the triangles in the sideways or alternate formation within the corrective phase of Elliot waves. More complex still may be combinations of the patterns, e.g., the double or a triple zigzag, or still a flat zigzag triangle.
The zigzags formations are straightforward in appearance and formation. And they'll often form as 3-waved movements in opposition to the direction of the main trend. However, in between, they may comprise some subdivisions of the main waves.
When looking deeper at the flats, you’ll find 3 types of the according to appearance:
- Normal Flat
- Expanded flat
- Running flat
The normal flats have a similarity to the zigzag. However, the waves to a normal flat tend to have retracements with lesser extents than those of a zigzag. The reason for the unique retracements arises from the overwhelming forces it faces from the main trend – which therefore only allows 3 waves to the formation.
For an expanded flat, it occurs whenever wave a is more powerful than the retracement while wave b forms. Please note that the normal wave c in an expanded flat tends to hold prices within an equal range or exceeding the lengths if you compare them with wave a.
The last unique note concerning a running flat occurs whenever wave b makes a retracement that exceeds the length of wave a to a larger extent– while wave c makes a projection that is shorter than one for wave a.
Triangles often have a key point whenever they form. Usually, it reflects equal power between the bears and the bulls. Therefore, the prices tend to move in a sideways fashion, and over the consequent timeframes, the volumes and volatility keep decreasing.
When you analyze the triangles, you’ll find three distinct classifications according to the shapes they occur in.
One is the contracting triangles. You may find them also being referred to as symmetrical triangles. And they can either be ascending or descending triangles. To be specific, an expanding triangle is the same formation but in an inverted form, and of course, its’ appearance happens within the confines of 2 trendlines that are diverging.
Elliott Wave Patterns Theory Trade Rules
Trading the Elliot waves takes more than merely spotting the formation.
Here, we’ll break down what it takes to take on the opportunities with the pattern.
- First, traders have to wait for the reversal of a high wave degree featuring a major bull market. Here you work with a trendline
- The next thing to look for is the formation of the two waves 1 and 2
- Next, enter trades as price action begins wave number 3. Also, at trade entry, remember to set a stop-loss position below wave 1 and at exactly 61.8% of wave 1
- Your target take-profit position is at the point where wave number 5 starts to show potential weaknesses – as it prepares for the corrective phase of the Elliot waves
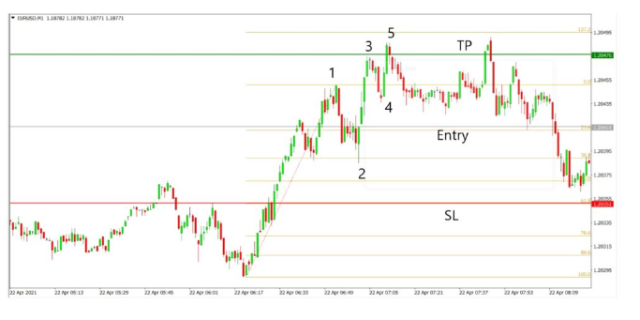
Pro Note: The above setup is applicable for both trades – going long on a bullish trend as well as going short.
Next, we will enter via price action at the beginning of wave 3 and set our stop-loss below 61.8% of Wave 1, and set our profit target at first.
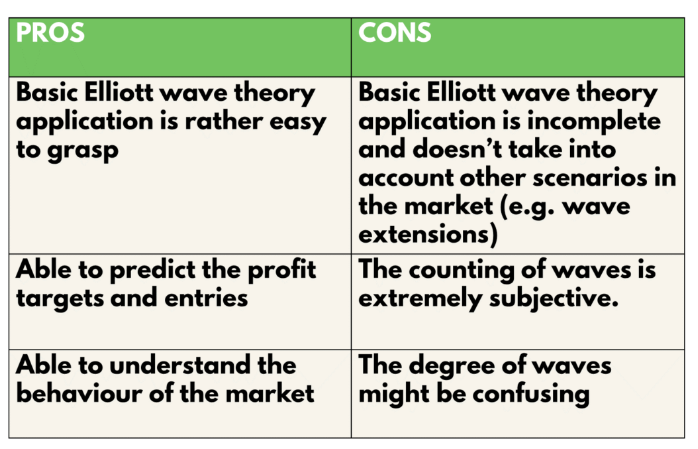
Elliot Waves Pros and Cons
One key benefit of the Elliot waves pattern is the ease of grasping the concept and trading successfully using it. Beginner traders with a reasonable understanding of price action are able to figure out market behavior following the Elliot waves concept.
It’s a simple pattern to trade with. It has key regions for opening a trade, setting stop losses, and taking profits. The confidence the Elliot waves instill into the mindsets of traders is also a critical component for their trading in the markets via other patterns and strategies.
Analysis of the Elliott wave theory
Earlier in the promise, there’s a mention of the practical analysis to see the profitability of the Elliott Wave theory as a trading strategy. Towards achieving that, we’ll take a backtest arising from 10 trades taken from the 11 of July 21. The applicable timeframe is One Minute or the M1 timeframe. Also, we are going to apply the rules per the indications made earlier in this post.
The Elliot waves theory is applicable across every financial market. And therefore, to help us obtain the variety, we pick on three investment vehicles. Each represents a broad category of the assets under it – including commodity markets.
Our special choices for the backtests are:
- EURUSD is a popular forex currency,
- US30(DJI) to stand in for Company stocks
- BTCUSD is a rep of the crypto-assets industry
One more very important note for simplicity, we’ll take our trades with a risk of 1% of the capital in our accounts.
Key Terms Definitions:
- Our applicable Average Risk Reward Ratio =
(The total risk-to-reward ratio for all the trades won / The total number of winning trades)
- Profitability in percentage gains (% gain) =
(The number of wins Rewards)- (The number of the losses made X 1) [ Our applicable risk is 1%]
Next, there’s a graphic presentation of the chart relating to the strategy of trading the backtests for the Elliot waves strategy:
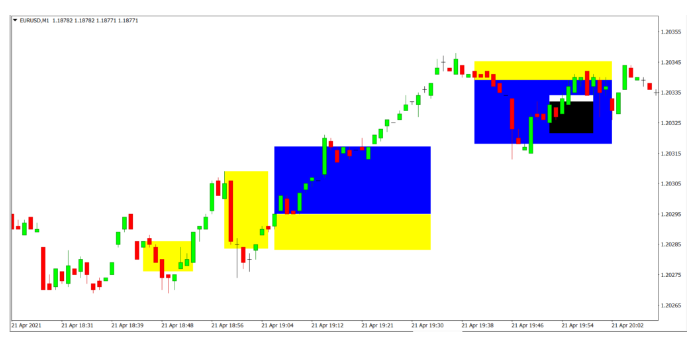
As a graphical synopsis of the results of the backtest results –the regions shaded in blue and yellow represent the areas of the trades taken.
In that order, the Blue color shows the zones indicating the rewards won. Yellow stands for the risks taken while at the backtests for the strategy.
Backtest Results: Elliott Wave Theory Patterns
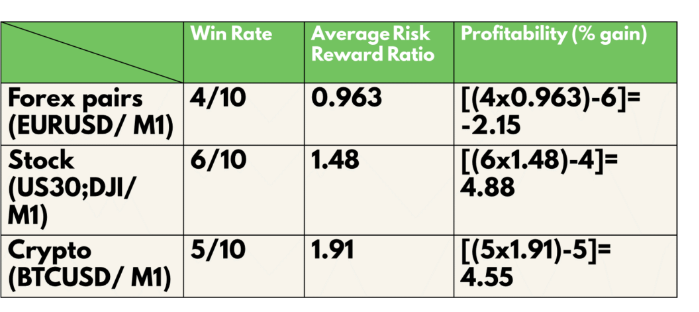
First are the winning rates for the strategy:
- Forex EURUSD pair has a win rate of 40%
- A stock US30 DJI scores a win rate of 60%
- A crypto-assets the BTCUSD scores a win rate of 50%
Secondly Are the Average Risk to Reward Ratios:
- The risk-to-reward ratio for Forex pair EURUSD is 0.963,
- The risk-to-reward ratio for a stock, the US30 is 1.48
- The risk-to-reward ratio for BTCUSD is 1.91
Thirdly Are the Profitability Scores for The Strategy:
- Forex pair EURUSD (Forex) scores profitability of -2.15
- Stock USD30DJI scores profitability of 4.88
- A cryptocurrency, the BTCUSD scores profitability of 4.55
Best Forex Trading Course

The best forex trading course is the One Core Program by Asia Forex Mentor. Traders with a real vision to fast-track their journeys into profitability by learning from the best. One Core Program features correct trading psychology, best risk management approaches, trading professionally, and a mentorship component.
One Core Program takes traders from beginners to advance with a holistic approach to trading. Retail and institutional traders go over to make six-figure trades from a mathematically proven model that protects capital and helps them with lifetime career skills at conquering the markets.
The One Core Program represents what you’d take to learn over two decades to find the correct strings on your own. It’s a form of give-back to society. One Core Program is the course with which Ezekiel Chew has trained a list of leading banks and financial institutions around the globe.


Best Forex Brokers
Conclusion: Elliott Wave Theory

As you may see, the trading strategy for the Elliot waves is really insufficient for conquering the current markets on its own. Despite the win rate from the backtest being reasonable, it also brings in a very good risk-to-reward ratio at trades.
If you zero down to forex trading, the Elliot waves trading strategy is very low and traders will really require to put in more effort at making it through with the low profitability from the strategy. Everything said and done, the Elliot waves theory brings in very insightful and foundational market analysis angles.
There's no doubt, that by coupling the Elliot waves analysis with other indicators and a more precise price action analysis, traders stand very high chances of reaping bigger win rates. Therefore, Elliot wave requires more in-depth and advanced approaches to enable traders to conquer the markets successfully.
Everything else said and taken notes of, the basics concepts of the Elliott Wave theory are simple acronyms in a list, whose complex unraveling and understanding require tacking an in-depth topic for each.
As such, mastering Elliot waves are a great basic step at building the foundational pillars of excellent trading into the latter stages with the consistent build-up of more strategic focus on trading the markets with more expertise and amazing clarity at it.
Elliott Wave Theory FAQs
Is The Elliott Wave Theory Accurate?
Yes, the Elliot waves are an accurate model for analyzing price action. Once a trader gets the concept at the back of their mind, it only helps upscale their accuracy.
The waves are often clear. But the markets are ever trickier to discern. As such, variations of the generic Elliot wave pattern may occur and only add to the confusion of traders – especially beginners.
Are Elliott Wave Theory Worth Learning?
It’s worth learning the Elliot waves theory by Ralph Nelson Elliott. The best way to approach the concept is to have an idea of the basic shape. Further, make attempts at noting the variations that occur with the pattern.
Elliot waves prove worth learning if traders take them as part of market analysis by coupling them with a few more indicators to enrich the analytical insights.


