
Want to jump straight to the answer? The best forex broker for traders is Avatrade
The #1 Forex Trading Course is Asia Forex Mentor
Fibonacci Ratios: Video Quick Setup Tutorial
Fibonacci ratios trading strategy approaches forex trading with a sequence of numbers known as the Fibonacci numbers. The whole theory behind Fibonacci numbers and their occurrence in nature stems from the work of a prominent Italian mathematician – Leonardo Bonacci.
The formula for obtaining Fibonacci sequence numbers or ratios is dividing a number in a series by the subsequent one. The result is the occurrence of the Fibonacci golden ratio of 0.618. The golden ratio is a common occurrence in nature – in some shells and some flower petals.
While Fibonacci numbers are applicable across many disciplines in nature, they are a surprisingly huge supplement to trading forex. There are sets of technical analysis tools that arise from the Fibonacci sequences that provide valuable insights to traders trying to capture the right predictive models with price action.
Towards enriching the insightful analysis with Fibonacci in trading, we invited the technical expertise of Ezekiel Chew, a Lead Mentor, and Trainer from Asia Forex Mentor. With more than twenty years of expertise in trading, He will guide us through the application scenarios with insights and backtest results run on several assets to give credibility to the results.
It’s also worth mentioning that Ezekiel Chew is living proof that many traders can explore, emulate and learn from. Apart from Fibonacci sequence ratios in trading, there are many more that he covers via the portal – Asia Forex Mentor.
As you read on, you’ll get to know more about the best forex course you can take on to transform your knowledge of forex. Therefore, reading this piece will impart core knowledge on Fibonacci ratios trading strategy, its tools, and their best situations of application in your trading career.
Fibonacci Strategy: Fibonacci Retracement

The occurrence of Fibonacci retracements shows as a series of lines showing the probable levels of support and resistance levels on a price chart. Fibonacci ratios show the likely zones of price action, which builds on the prior movements in past time frames. Essentially, the lines are possible percentages of the estimates.
Grasp the key Fibonacci ratios with Fibonacci retracement levels or zones – which are 23.6%, 38.2%, 61.8%, and 78.6%, retracement levels in that order. It’s also common to find traders with an interest in the Fibonacci ratio of 50%, though not commonly used but it makes sense to work around it also.
Also, of lesser interest is also the use of the Fibonacci extension tool. When the Fibonacci extension comes into the picture, the common points that draw interest are 127.2%, 161.8%, and 200%. Plotting the Fibonacci extension shows the extreme price limits.
Working with the Fibonacci Retracement levels, two significant points come into focus – a swing high and the corresponding swing low. Experts say that the strongest zone of rejection with prices arises within the range of 38.2% – 61.8% retracement levels. And it’s the main reason the level is known by the term the “Golden Zone”. Following the Golden zone, the next level of price rejection arises at the Fibonacci extension levels 127.2% and 161.8%.
The two rejection regions above are also known as take-profit regions. Depending on the momentum of a market, extremes arise where traders use the 200% Fibonacci extension to take profit instead of the region around the 161.8 % Fibonacci extension.
Note that for the purpose of this post, our applicable take profit region is the 161.8% level.
How to use Fibonacci
The correct way to use a Fibonacci retracement is to draw it from a position of a swing low and drag it to the point of a swing high. Therefore, the correct way is to see that the point 0% on the plot rests on the swing low. Also, the swing high position should align with the 100% mark.
For emphasis again, the Golden zone offers very high resistance. Therefore, we’ll use it to look for an entry point. The key point here is to look for a nice bounce of the prices into the golden zone.
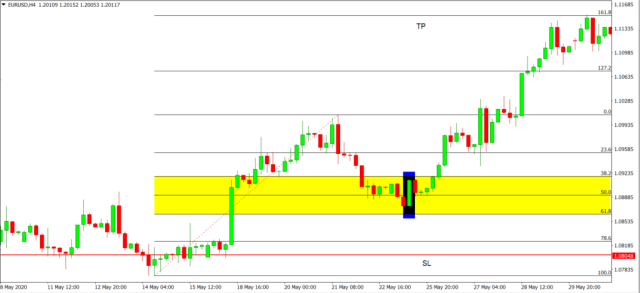
The specific point of entry is to look for the close of a highly bullish bar within the Golden Zone. So for an uptrend, you look to locate a bullish bar that is facing rejection as it attempts to burst into the Golden Zone.
For the stop-loss orders (SL), the ideal position to place them is at a position slightly under the 78.6% Fibonacci retracement levels – refer to the above image.
The ideal take-profit orders positions (TP) are at the position marking the Fibonacci extension level of 161.8%. Ideally, no trades are opened whenever prices fail to hit at the least the 38.2% level within the Golden Zone.
Pros and Cons
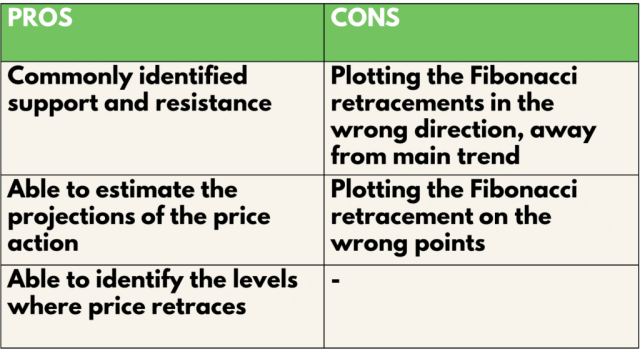
For one, the Fibonacci retracement tool is very versatile when it comes to its areas of application in trading forex. Its flexibility is dynamic as prices keep shaping the charts with different positions for swing lows and swing highs. It’s a tool that brings insights to trading by building on realistic zones for price support and resistance.
Agreeably, traders find it an insightful tool by helping analyze price movements through into resistance and the reversals or retracements that obviously follow with time. One huge drawback with the Fibonacci tool arises when traders make the wrong plots.
Of course, wrong plotting of the Fibonacci tool leads to wrongful decisions. And the wrong turns consequently bring in poor analysis and losses at the tail end of traders taking positions from wrong angles.
Ideally, the plotting of the Fibonacci retracement tool works best with trending markets. Therefore, making attempts to plot the levels within a consolidation or choppy markets is a very wrong turn. Aside from the losses that a trader incurs from wrongful plotting, the morale of a good trader is hurt and may lead to resentment, which works negatively on overall trading careers.
To be very clear, when a trader is able to plot the Fibonacci retracements in the correct direction and on correct points, it proves to be a very useful tool for any trend trading strategy.
Fibonacci Sequence Trading Analysis
We’ll move into a spree of practical explorations to see how the Fibonacci Retracement strategy works in financial markets. For the purpose of this post, we’ll carry out backtests involving batches of 10 trades. The trades in real-time cover the periods April 21 onwards, and our applicable timeframe is H4 (4 Hours).
For the backtest, entry conditions are as per our information earlier in the post regarding the Fibonacci retracement level, charting software, and the Golden ratio.
And to capture a variety of applicable financial markets, we choose three assets from the markets: EURUSD representing forex traders, AAPL for the stocks traders, and the BTCUSD to stand in for cryptocurrency traders.
Last note here, while backtesting the Fibonacci retracement level, all the 10 trades are taken with the equality of risking only 1% of the equity amount in the trading account on financial markets.
Fibonacci Strategy Definitions
- The Average Risk to Reward Ratio = (Total risk-reward ratio for the winning trades/ total number. of trades that win)
- Profitability (in Percentage or % gain) = (number of wins X Reward)- (number of losses X 1) [ Risks @ 1% of the trading account]
Next is a graphic showing the results of the Fibonacci sequence trading results:
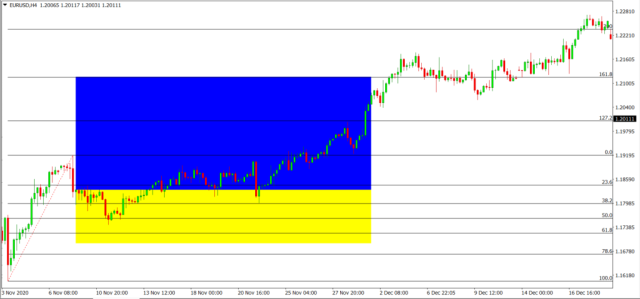
From the results of our backtests comprising the 10 trades, the Yellow regions indicate the risks taken. The Blue zones show the rewards taken.
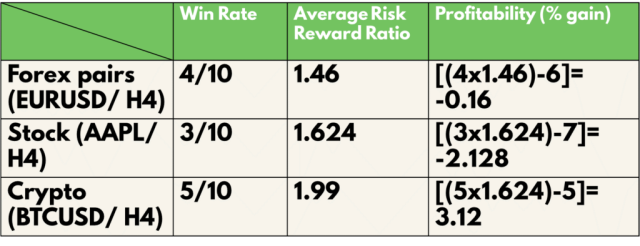
And next is a breakdown of the backtest results alongside the win rates per asset category:
- EURUSD representing Forex traders made 40%,
- AAPL representing the Stock traders hit a 30%
- And BTCUSD for the crypto-asset traders hit a 50%
The Fibonacci retracement sequence trading plan, according to our backtest results, shows the following scores for the risk-reward ratios:
- For Forex, EURUSD scores a 1.46
- For stock traders under the AAPL, the score is a1.62
- Cryptocurrencies represented by BTCUSD scores 1.99
Lastly on the scorecard is the profitability metric of the Fibonacci levels trading tests:
- First, EURUSD in Forex made -0.16,
- For the Stocks represented by AAPL, the profitability score is -2.13
- And Crypto-asset BTCUSD hits a profitability score of 3.12
Further Refining of Fibonacci Retracement levels Strategy Backtests
We took our analysis to another level. Bearing in mind that the 61.8% is the level known to have the strongest level of Fibonacci Retracement, we got to a step ahead to provide an SL (stop-loss) order position.
Our target purpose was to come up with two sets of outcomes. First is the Stop loss – SL level set below the 78.6% level. The next set of results is from the SL set below the 61.8% position.
Analysis of results per SL level shows the following outcomes:
Stop Loss orders set below 61.8%(Fibonacci retracement level)
- Forex under EURUSD scores a 20%
- Stocks under AAPL scores a 20%
- BTC USD as Crypto-assets scores 30%
Also, the average risk-reward ratios for the strategy show the following outcomes:
- EURUSD scores 1.58
- AAPL scores 1.82
- BTCUSD scores 2.47
Lastly, the profitability of the Fibonacci strategy is as follows:
- EURUSD at -4.84
- AAPL at -4.36
- BTCUSD is 0.41
With the tweaks above, our results make a huge difference. First, the winning rate for the trades under the Fibonacci retracement levels goes down drastically. On the contrary, there was an increase in the risks for rewards that you have to take as a trader.
Also, the profitability of the strategy also drops. This goes on record to show that working on trades with a slightly larger stop loss while trading the Fibonacci retracements is a better option to consider taking on.
Fibonacci Fan
Fibonacci fans arise from sequential trendlines arising from a swing low point and extend through a trough formation as prices oscillate towards the peak. The lines resemble a fan formation picked from angles that are guided by Fibonacci retracement levels or ratios.
The fan shape builds from a trendline but also comprises other probable trends, and each stems from a given angle at the base of the fan. The main trendline within the fun also connects the lows and the highs of the prices for any given time frame for an asset.
Fibonacci fans form part of chart technical analysis. The angles arise from the Fibonacci ratios, and the lines extend in a formation, helping traders spot the zones of price resistance and support from the chart.
Earlier on we made mention of the visible evidence with Fibonacci numbers and their appearance right in nature. Other spheres in which Fibonacci numbers are applicable are in atomic sciences and extend to other complex stuff like celestial bodies.
Theoretically, nature attempts to make proportional balances, and the same aspect conforms to the applicability of Fibonacci ratios in price action and analysis of market behavior overtime – where the Golden ratio finds applicability.
How to use Fibonacci Fan
Fibonacci fans are drawn starting from either a swing low or a swing high position. The line formations connecting the starting point for the base trendline and each retracement level create the Fibonacci fan.
The lines of Fibonacci retracement levels on the Fibonacci fan represent a series of ratios: typically, 23.6%, 38.2%, 50%, and 61.8%. The connections between the base trendline and the extremes of prices each mark the key retracement levels forming the fan.
In terms of application, traders look at the positions of the fan from a swing position to look for possible expectations of prices making reversals. Over and above the Fibonacci fan offering insights regarding the resistance and support probabilities, it helps to firm the analysis regarding the future points of entry and exit of trades.
Fibonacci Time Zones
The Fibonacci fan is an extension of trendlines from a position of a swing high or a swing low position. Traders follow the price action within the coverage of the fan to help predict the levels of resistance and support as prices extend into the future time frames.
Therefore, the application of Fibonacci fans entails accurate plotting from either a swing high or a swing low position.
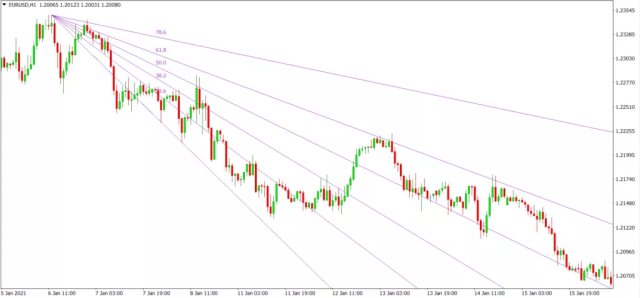
Looking at the image above, we see a Fibonacci fan applicable to the forex currency pair EURUSD.
Looking across the image, the series of trendline formations helps traders with the identification of levels of resistance. Traders look to take advantage of the market oscillations between resistance and support in light of the general trend of the prices.
How to use Fibonacci Time Zones
The time a trader gets into markets and opens positions matters. For day traders, knowing the time zones helps especially if they target to benefit from the huge volumes of trading whenever some sessions overlap.
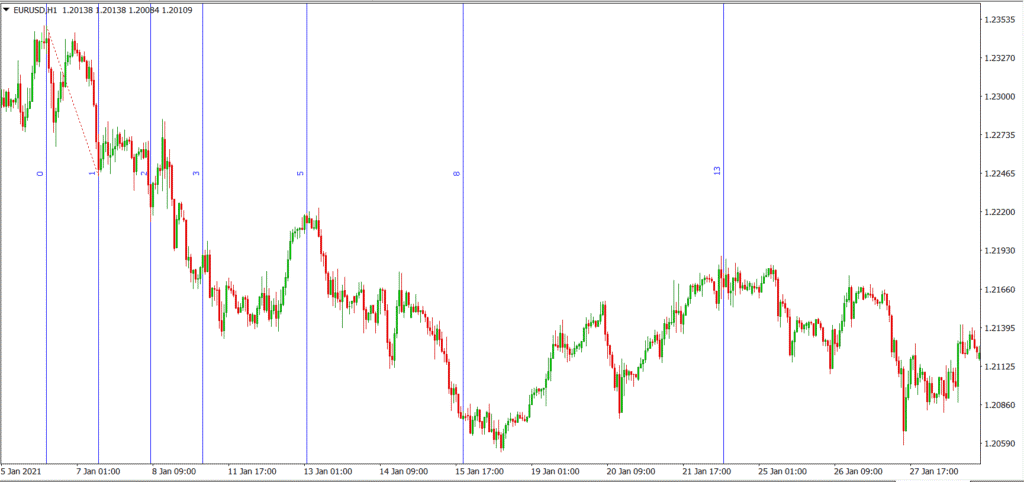
Using the Fibonacci time zones brings higher insights especially when traders are able to clearly spot resistance and support levels.
The tool plots based on a swing high and a swing low, plus it relies on the direction of the trend.
For example, see the image above showing the Fibonacci time zone plotted on the chart for the currency pair EURUSD. Each Fibonacci retracement line represents a sequence in accordance with the swing highs and swing lows.
The Fibonacci time zone tool shows the probable future time frames – along the X-axis and the probable dates when the market will change directions as per the trends. It’s also worth mentioning here that the Fibonacci tool may not help with the prediction of the intensities of pivoting or turning that a market is likely to take.
Best Forex Trading Course

Having covered the concepts of Fibonacci Retracement levels strategy, it’s time to shift course in the direction of your trading career. And the best forex trading course to help you digest all concepts and accelerate your progress towards greater heights is the One Core Program by Asia Forex Mentor.
One Core Program is a course in which the lead Trainer – Ezekiel Chew aims to pull you into an inner circle to share over two decades of efforts that culminate into an expertly crafted path to better trading. There are many free materials you can read and get insightful trading content via the Asia Forex Mentor. However, the One Core Program comes to fast-track your progress.
One Core Program is the course that has helped both retail and institutional traders to level up their game at everything they need to know and turn the tables of their trading careers for the better. One Core Program is a balance of many aspects that traders miss in the markets.
Among the outstanding benefits of the One Core Program is the ability to transform all traders – retail or institutional into a mindset of winning traders. Ezekiel dabbed it as Lifestyle trading. And you must not quit your job or hobbies to get to learn and trade onwards successfully. Lifestyle trading only requires as little as 20 minutes daily for you to onboard with the winning habits.
Lastly, one key aspect you'll come to appreciate is the proven path to success. Ezekiel lays emphasis on the fact that winning in trading is not a cumulative effect of trading in fear and greed while staring at charts all day. Enroll and take on the One Core Program to best grasp the sure bullet to your lifetime of successful and fulfilling trading careers.


Best Forex Brokers
Conclusion: Fibonacci Retracement Levels Trading

The purpose of this post is to help you grasp the finer details of the Fibonacci trading. In it, we cover the original conceptualization of the Fibonacci number in nature, which culminates in the Golden Ratio. Its application is wide, and trading is among the prime beneficiaries of the insights with Fibonacci retracement numbers.
Reading along, a trader will be able to appreciate the reasons why correct plotting is the core to successfully trading the strategy. Digging in deeper, the coverage extends into two key versions. One is working with the Fibonacci retracement, and the second is working with Fibonacci extensions. However, there’s also a fine coverage of other key Fibonacci tools like the Time Zones tool and the fan.
One key and interesting component of this post is the coverage with live backtests and documentation of the results. And one critical component is the profitability of the Fibonacci strategy, which is quite lower. But surprisingly, using a larger Stop Loss dramatically upscales the odds of making profits with it.
There’s the portion covering the advantages and disadvantages of Fibonacci retracement levels trading. There's no doubt according to the inferences from the backtests. Trading the strategy alone is not the best pathway for a trader. But it's very helpful with other trend trading strategies.
With that mentioned, it's best to take on Fibonacci as a part of a technical analysis where you support probable support and resistance levels with prices. And, of course, bring in other analytical tools to update your odds of batter analysis of price action before trade setups.
Surprisingly, the Fibonacci retracement levels strategy is applicable for any investment vehicle – whether forex cryptocurrencies or stocks. Since the surest way to trading successfully is deeper analysis, we can agree that the Fibonacci strategy and tools are a great arsenal for every trader looking to conquer the markets out there.
Fibonacci Trading Strategies FAQs
What is Fibonacci Retracements Trading Strategy?
The Fibonacci retracements trading involves plotting the Fibonacci levels tool by linking a swing high to a swing low or the reverse in a trading chart. The strategy rides on the natural occurrence of the Golden ratio, which applies in forex amongst a host of other disciplines in life.
As with other trend trading strategies, using the Fibonacci retracement levels are able to give probable zones of support and resistance. And traders look for huge movements as the markets approach the Golden zone. Building on the predictive nature of the tool, traders must work with correct risk sizing and a stop loss for any eventuality of the market's trending away from projections.
Building from the knowledge of the Fibonacci trading strategies is two critical components – retracement and extension. For the extension, the critical ratio here is the 161.8% Fibonacci level. Apart from the knowledge of the golden zone and the critical Fibonacci levels, knowledge of accurate and correct plotting is a vital component of the successful trading of the strategy.
Lastly, as a strategy, the Fibonacci retracement numbers do not guarantee profitable trading – especially where wrongful plotting of Fibonacci retracement comes into the picture. It’s therefore a wise idea to work with the strategy to capture resistance and support, and rope in other tools to help with confirmations of volumes among other metrics.
Does Fibonacci (Golden Ratio) RetracementTrading work?
Yes, Fibonacci retracement levels trading works. Correct plotting of the Fibonacci tool helps a trader to predict the probable areas of support and resistance a market may hit in the future timeframes. Therefore, the insightful process comes into play where traders draw highly predictive insights and tap into them to help towards profitable trading with the Fibonacci extension.
Apart from the ordinary Fibo tool, is a Fibo fan, which works many traders use along with the main trend to show future oscillations of asset prices as prices push into future time frames. One wrong turn with the Fibonacci strategy is making attempts to trade with it in choppy markets – it will fail you like it best works with trending markets.
Fibonacci retracements trading works out right when traders use it as part of other technical analysis tools to supplement different trading strategies. And this is usually the best-advocated model. Once support and resistance are located using the Fibonacci extension, get into your arsenal of other technical indicators and trading tools like moving averages and trend lines.
Can You Make a Living Day Trading Forex?
A short answer is a YES. Many people out there do it. However, one more critical question arises. Does day trading mean staring at screens all day or jumping in a few hours or anything in between?
Day trading is usually hectic, especially when markets are too volatile where many traders on foreign exchange may end up losing money rapidly. The best way to approach trading is to move high expectations out of the picture first. The next step is laying your hands on a very low-risk model trading CFDs or foreign exchange with retail investor accounts with very high winning chances with different trading strategies building on the Fibonacci indicator.
Arguably, it would be better to work with a low-risk model that goes for an Elliott wave on the stock market weekly charts. Their winnings are far much worth the daily closes for day traders if we compare the amounts of profits side by side.
Trading long term, taking low risks, and going on with life hobbies or jobs is a great way to achieve high ROI – almost with zero fear and zero greed while trading happily and going on well with life.


