
Want to jump straight to the answer? The best forex broker for traders is Avatrade
The #1 Forex Trading Course is Asia Forex Mentor
As a trader, you must understand how important it is to estimate the strength of a trend price momentum and its future potential. Well, that's what the Chaikin Oscillator indicator does. Marc Chaikin created the Chaikin Oscillator in the 70s and successfully used it to trade stocks on Wall Street. He later sold his company to Goldman Sachs.
The Chaikin Oscillator is a momentum indicator used to gauge the strength of price momentum and future potential. The Chaikin Oscillator is derived from the Accumulation Distribution Line (ADL) created by Larry Williams. The Chaikin Oscillator is calculated by subtracting the ADL's ten-period moving average (EMA) from the 3-day EMA of the accumulation distribution line.
We have asked Ezekiel Chew, an experienced forex mentor, to break down the Chaikin oscillator concept for this technical indicator. Ezekiel Chew is the founder and head of Asia Forex Mentor – one of the world's largest and most successful forex education companies. He is a highly sought-after speaker and trainer, having educated tens of thousands of traders worldwide.
This guide includes in-depth details about the Chaikin oscillator, how to interpret it, its calculation, pros and cons, and more. So, let's get right into the details.
What is Chaikin Oscillator
The Chaikin Oscillator is a momentum indicator used to gauge the strength of price momentum and future potential. This oscillator measures the accumulation-distribution line of a security over a specified period. The A/D line is a running tally of each period's closing price multiplied by the period's volume.
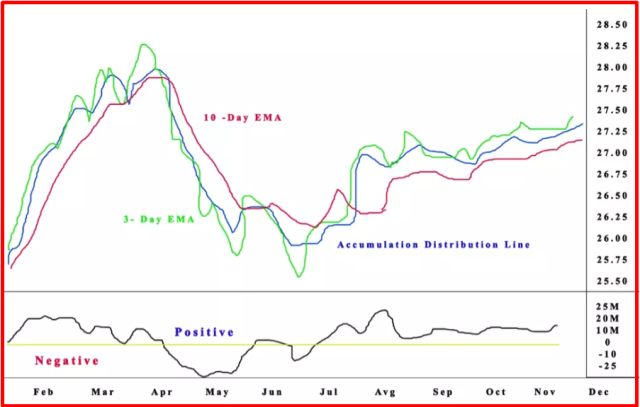
The Chaikin Oscillator is derived from the Accumulation Distribution Line (ADL) created by Larry Williams. To calculate the Chaikin Oscillator, you need to subtract a 10-day exponential average (EMA) of the accumulation distribution line from a 3-day EMA of the ADL. The accumulation-distribution line calculates momentum predicted by oscillations around the line.
Compared to other volume oscillators, Chaikin replaces the day's average price for the opening price. As a result, the Chaikin oscillator generates more timely signals than other oscillators and can be used to identify bullish and bearish divergences. In addition, the signals cross the above or below zero line. The price trend is facing resistance, so an opposing force has developed.
The market appears to be in a position where investors do not believe in the current price trend and anticipate a reversal in movement.
How to Interpret the Oscillator
The Chaikin oscillator indicates whether the stock is overbought or oversold. Also, the important thing to know here is that the Chaikin Oscillator is the indicator that measures the momentum of the ADL (Accumulation Distribution Line).
But what does it mean?
Well, the oscillator is at least three tiers removed from asset price. So, to start with price and volume, we have the A/D line (a measure of accumulation distribution). Then, we take an EMA of that.
After the Accumulation Distribution Line is created, exponential moving averages are implemented. The Chaikin Oscillator is then created by contrasting the different Moving Averages. However, because it is a derivative, there may be times when disconnects from the asset's price occur.
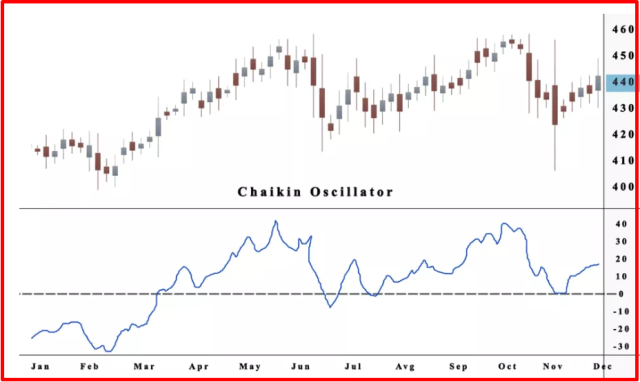
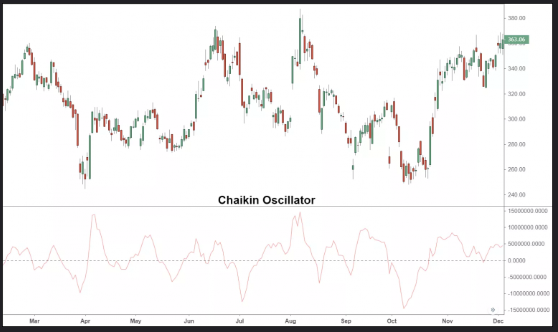
The indicator is created to signal whether the momentum behind purchasing and selling pressure is positive or negative. A rising line signals that buying pressure dominates. However, the movement in negative territory depicts the decline of the accumulation distribution line and a rise in selling pressure. Chartists use bearish and bullish divergences to find price movement shifts.
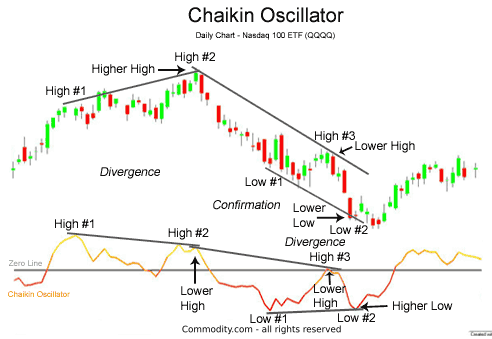
Divergence
Bullish and bearish signals warn traders about the change in momentum. The Directional Movement Indicator (DMI) finds bullish and bearish divergences.
Bullish Divergence:
When the stock price makes a new low, the oscillator fails to do so.
Bearish Divergence:
When the stock price makes a new high, the oscillator fails to do so.
A higher low indicates that selling pressure has decreased. Patience is key; you should look for verification in the form of a cross in positive territory. The movement into positive territory displays increased upside momentum as seen on the Accumulation Distribution Line.
Investors use the Chaikin oscillator to forecast potential changes in direction, similar to other momentum indicators. However, the Chaikin oscillator's significant advantage over other indicators is its ability to predict trend changes before they happen. This allows investors to jump on the competition and make better decisions about when to buy or sell an asset.
Two bullish signals are created by the Chaikin oscillator: positive divergence and a bullish centerline crossover. Similarly, the Chaikin oscillator can generate two bearish signals; bearish centerline crossover and negative divergence. Moreover, the bearish crossover at the centerline confirms the negative divergence.
How to calculate the Money Flow Volume and Money Flow Multiplier
The formula below calculates the Chaikin money flow volume and money flow multiplier. In addition, it calculates the Accumulation Distribution Line.
The Formula for the Chaikin Oscillator Is
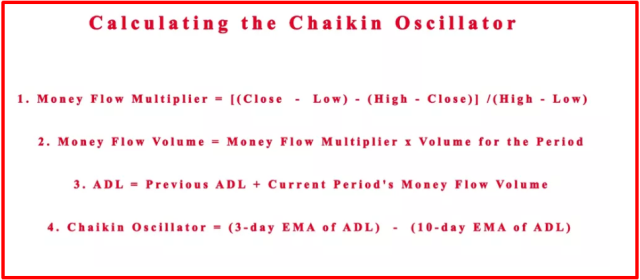
N = (Close−Low)−(High−Close)/ (High – Low)
M = Money Flow Multiplier * Volume(Period)
Accumulation Distribution Line = M (Period−1) +M (Period)
Chaikin Oscillator =(3-day EMA of ADL)−(10-day EMA of ADL)
Where:
N = Money Flow Multiplier
M = Money Flow Volume
The four steps to calculate OS are:
#1. Calculating the Money Flow Multiplier
#2. Calculating Money Flow Volume (N), take the Money Flow Multiplier (N) and multiply it by volume.
#3. Add N to a running total by constructing the accumulation-distribution line (ADL).
#4. To calculate the Chaikin oscillator, subtract the 10-period exponential moving average from the three-period exponential moving average.
To estimate the Money Flow Multiplier, begin by calculating the volume. Next, locate the Money Flow Volume. Finally, add the total Money Flow Volume to create the Accumulation Distribution Line (ADL). Then, to calculate the Chaikin Oscillator, take the difference between two moving averages. In conclusion, steps one through three are used to estimate the accumulation distribution line, and step four calculates the Chaikin Oscillator.
Is Chaikin Oscillator the Moving Average Convergence Divergence
The Chaikin Oscillator is similar to the Moving Average Convergence Divergence (MACD) indicator.
It indicates an indicator since it seeks to predict changes in the ADL indicator. The index relative location value (CLV) was used to calculate the ADL, contrasting a security's low, high, and closing prices.
The CLV will be negative if the closing price is under the midpoint of the high-low range and positive if it's over.
Advantages and Disadvantages of Chaikin Oscillator
If you have been using technical analysis tools for a while, you must understand that every tool has positive and negative aspects. You need to understand both before applying to get the best results. You must also know how to harness the trend strength and not get trapped by the price action.
Despite having the best track record, traders and investors use the Chaikin oscillator more often. That's why it is hard to get proof of the profits earned by this oscillator.
When compared to other momentum indicators, the Chaikin oscillator may appear complicated. However, some of the same concepts apply, and day traders can benefit from the Chaikin oscillator. However, it has been in circulation for over 50 years and contains a wealth of data to analyze that exposes the benefits and disadvantages of the oscillator.
Some of the advantages and disadvantages of using a Chaikin Oscillator are:
Advantages
- It helps you understand the market's mood and where it's heading
- Quick indicators and values are not redrawn
- It can be used along with the other technical indicator
Disadvantages
- Other tools are required for confirmation and to remove frequent deceptive alarms
- The versatility of the oscillator might be perplexing to newbies and seasoned traders alike
Best Forex Trading Course

Asia Forex Mentor is one of the most credible forex trading courses available today. It is headed by Ezekiel Chew, a trader making six figures per trade for over a decade. The trading methods are backed by mathematical probability and the trainer behind banks and trading institutions.
AFM PROPRIETARY ONE CORE PROGRAM is the core program that covers from beginner to advanced, and every segment must include the above points. The program is designed to make you confident and earn as quickly as possible in live markets.
It starts with the basics of forex trading and moves on to more advanced topics such as risk management, market analysis, and trade execution. The course also includes a live trading session where you can see the techniques being applied in real-time. If you're serious about learning forex trading, sign up now!


Best Forex Brokers
Conclusion: Chaikin Oscillator

The Chaikin Oscillator (CO) is a little-known technical indicator that is used by a small number of investors to check and confirm price trends. The benefit is that, while it isn't particularly popular, it's still a useful tool for traders if they learn how to use it.
Many investors trust volume to determine the future direction of price. The Chaikin oscillator works to show the balance between volume and price, which traders can use on their own or with other indicators.
When the CO is high, the accumulation distribution line is low around the asset price, indicating that selling pressure on the asset is increasing and that a price reversal may be near. Conversely, buying pressure rises when the CO is low, and so does the anticipated price increase.
The oscillator can help investors figure out when it's the greatest moment to sell or acquire stock and get out of the coming reversal. But, of course, the best results are gained through practice, so open a demo account, employ your favorite charting software, and experiment to discover your best approach in the chosen market.
The Chaikin oscillator may be used by day traders who believe they can predict the future. Traders are always looking for trading signals that might signal a trend reversal.
The most beneficial financial advice for novices is to grasp the subtle intricacies of technical indicators to prevent situations where losing money swiftly is a distinct possibility. This indicator can be very effective with other tools, such as support and resistance levels. Before risking real money, remember to test any trading strategy on a demo account.
Chaikin Oscillator FAQs
Is the Chaikin Oscillator a Good Indicator?
The Chaikin Oscillator is a good indicator for day traders because it's quick and easy to interpret. As a result, it can be used to show the market's mood and predict where it's heading. Moreover, it allows analysts to confirm other Chaikin’s theories about buying and selling pressure.
How do you read a Chaikin Oscillator?
The Chaikin Oscillator is a momentum indicator that measures the difference between price and volume. When the reading is above 0, it indicates purchasing pressure; when it's below 0, it implies selling pressure. D divergence is the most common signal resulting from a difference between the indicator and price movement.

