
Want to jump straight to the answer? The best forex broker for traders is Avatrade
The #1 Forex Trading Course is Asia Forex Mentor
If you have been trading for some time, you must understand the importance of technical indicators and how they can help you make better trading decisions. They are not only tried and tested tools but also give you an edge over other traders who do not use them. Williams Percent Range is one of the traders' most popular technical indicators to find market reversals and confirm breakouts.
The Williams Percent Range, also known as Williams %R, is a momentum indicator that displays where the prior closing price is compared to the greatest and lowest prices of a given period. It also gives RSI-like vibes in assessing the current trend's strength. Traders use %R's extreme levels (-20 and -80) to determine trend strength.
To understand the concept of Williams %R, we have got Ezekiel Chew, the CEO, and founder of Asia Forex Mentor. Ezekiel is a highly respected figure in the forex industry and is widely considered one of the top authorities on technical analysis. He will explain this indicator strategy and show you how to use it in your trading.
The other topics that will come under discussion are how to calculate Williams Percent Range, its pros and cons, and more. So, let's get started.
What is Williams Percent Range Indicator?
The Williams Percent Range indicator (WPR) is a momentum indicator that measures overbought and oversold levels. The WPR oscillates between 0 and -100. Readings above -80 signal overbought conditions, while readings below -20 signal oversold conditions.
This indicator can be used to find out the entry and exit points of the forex market. It is quite similar to the Stochastic oscillator used like Williams %R. The Williams %R is a momentum indicator that compares the closing price of a stock to the high-low range over a certain length, usually 14 days or periods.
Larry Williams discovered the Williams percent range strategy, which he used to make large amounts of money. The Williams %R lets traders compare the final closing price of an asset to the highest and lowest low prices of that asset within a given look-back period. This comparison can help traders figure out when to open or close positions in a market.
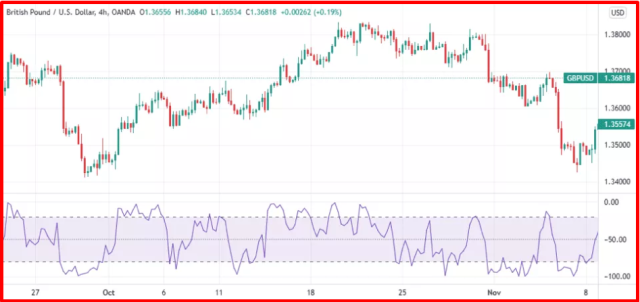
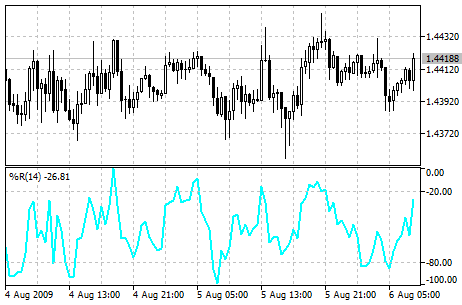
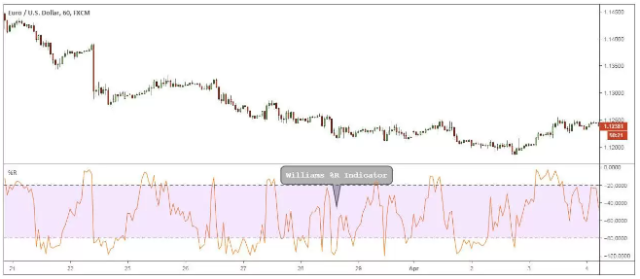
The Williams %R can be found on the bottom of your trading platform, as seen in the GBP/USD currency pair example below on a daily chart on trading view. It is labeled as the Williams $ R14.
Williams Percent Range Strategy Explained
As discussed earlier, the Williams % R oscillator helps to determine the underlying security if it's oversold or overbought in the forex market.
Overbought assets will have a Williams % R of below -20, while oversold assets will be above -80. To keep this in perspective, it is worth mentioning that these levels do not conclusively mean there will be a price reversal.
Instead, the overbought and oversold readings merely show if the current price of an asset is approaching the top end of its recent range (overbought readings) or if it is near the lowest low price point of its current price or trading range (oversold reading).
This trading strategy is mostly used in 2 ways:
To indicate the price reversal or to indicate the continuation of price consolidation or trend.
Williams Percent Range As A Momentum Burst Strategy
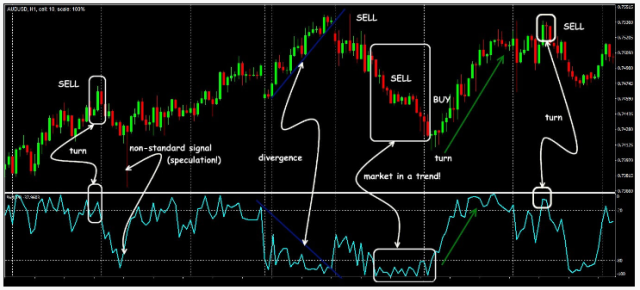
Here is an example of a bullish % R momentum burst strategy.
The Williams % R may fall below -20 in a strong bullish trend (strong upswing). This might indicate that the price is about to reverse since the value of the Williams % R may fall below -20. On the other hand, if the price keeps going up and the value of the %R doesn't go back above -20, that's a sign of a bearish reversal. You should use another indicator or other market factors as confirmation before taking any action.
The Williams % R may fall to -80 or lower, even though the market is in a strong bearish trend. It could indicate a price reversal if it occurs, implying that an asset has been undersold. Once again, another indicator should be used to corroborate the price change.
Bullish Movement % R Momentum Burst Setup
The image above labels zones A, B, and C. In these regions, prices typically rise steadily until the Williams R % goes above -20 (the overbought territory), after which a bearish reversal often occurs.
The prices continued to rise while the % R indicator stayed at or below – 20 and above. When the Williams % R becomes greater than 90%, it is a sign that the price has reversed. However, according to zones A and B, the Williams percent R is the best indicator for determining entrance and exit points. Therefore, you'd need to add another indicator to the mix to utilize it as a reversal pattern.
Bearish Movement % R Momentum Burst Setup
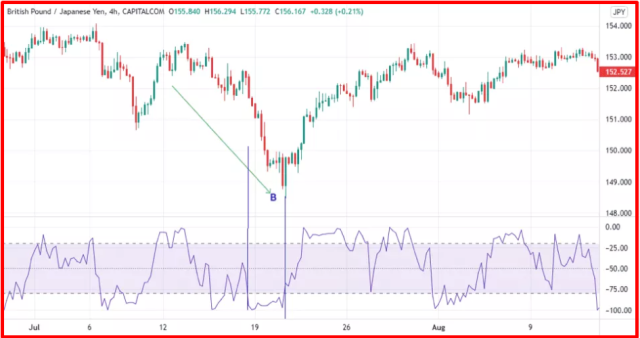
A bearish R momentum burst is shown in the image above. Area B should be noted since prices continually drop to point B while the Williams R remains below -80 oversold levels. Prices then make a significant advance, as seen in area C.
Note that in order for the Williams % R to indicate a significant price movement, prices must continue moving in a specific direction. At the same time, the Percent Range remains within the extreme overbought and oversold ranges.
Williams Percent Range As A Trend Continuation Strategy
In terms of continuation, we'll target the Williams R % -50 zone as the next step. The Williams R % indicator shows a distinct difference between overbought and oversold readings. As a result, it indicates an alteration in momentum in the price action of a specific security or financial instrument. When the William R percent reaches -50, momentum has changed.
If the market direction and the R % indicator move in the same direction after crossing the -50 mark, price trends will continue. Therefore, traders can open positions supporting this direction until the R% indicator reaches extreme levels or crosses back over the -50 mark.
When the R-indicator is on the top half of an asset, it indicates that the price is overbought; when the indicator is on the bottom half, it indicates that the price is oversold.
The William R % must have come from the extreme levels of either -20 or -80 in order to confirm a change in momentum. When the R % indicator fluctuates between the -80 and -20 ranges but never crosses the -50 threshold, it can be said that the market is consolidating.
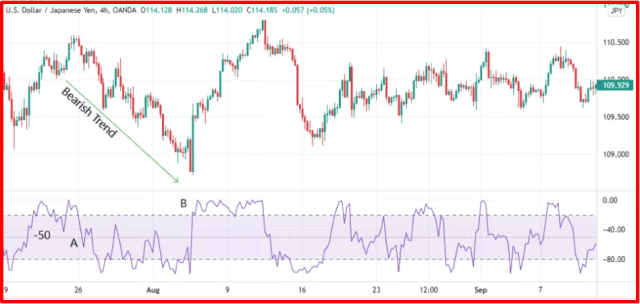
% R Continuation Strategy Setup
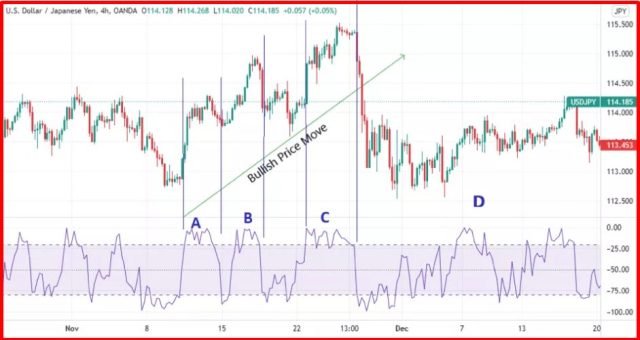
Using the Williams Percent Range, you can indicate possible trend continuation on the USD/JPY 4-hour chart, as seen in the image above.
The RSI indicator is a valuable tool for traders that can be used to predict market movements. For example, when the RSI exceeds -50, it usually signals that the market will move in the same direction.
The image above shows a bearish trend. The % R indicator crosses the -50 mark at point A after coming from an overbought level, triggering the bearish trend in the image. The trend follows through with the percent range indicator testing the -50 mark a few times before finally reversing to region B. From price point A, the trader should have a Sell order open as prices drop gradually.
The above idea can also be used in a bearish market. When the % R crosses -50 from an oversold position, traders can start placing buy orders until the market reaches the overbought zone.
How do you calculate Williams Percent Range?
The Williams R % indicator is frequently used because it is easy to calculate. The formula for the Williams % R is:
%R= ((Highest high-Close))/((Highest high-Lowest Low))× -100
Where:
- Highest High= The highest price in the 14-day lookback period
- Close= Most recent closing price
- Lowest Low=Our lowest price within the last 14 days
In most cases, the Williams%R is calculated for 14 days. However, traders can always change it according to their preferred period number. Most trading platforms have an inbuilt Williams % R indicator, so you don't need to understand how to do it. Just look for it in the indicator section of your trading platform.
Williams Percent Range Oscillator vs. Stochastic Oscillator
The Williams %R is quite similar to the Stochastic Oscillator. Both indicators show overbought and oversold conditions in the market, and both use the 14-period look-back period.
However, there is one main difference between the two indicators. The Williams % R is concerned with the connection between the close and the highest price.
In contrast, a stochastic oscillator focuses on the link between the most recent closing price and the lowest low within a certain time frame. As a result, the scaling of their charts varies depending on whether or not they are positive or negative, while the stochastic oscillates from 0 to -20.
Pros and Cons of Williams Percent Range
Pros
- William Percent range is easy to use for both beginners and experienced traders.
- The Williams % R is a popular technical indicator that is found in many trading platforms and applications.
- The law of supply and demand determines each financial market, so knowing a certain asset's overbought and oversold levels can be beneficial.
Cons
- It's important to know whether a stock has reached or exceeded the overbought or underbought threshold in order to signal an entry or exit, but not market directions.
- This indicator can be inaccurate, especially when the market is making small moves, as it is quite a responsive indicator.
Best Forex Trading Course

Asia Forex Mentor offers the best forex trading education in Asia. The course is set up so that you can earn money while learning. You'll be able to trade forex profitably with a skilled trader's help. In Singapore and other sites worldwide, tens of thousands of people from the United States, the United Kingdom, and other Asian countries have been taught.
Ezekiel Chew's teaching method is founded on the principle of return on investment, which states that if you invest $1, you will gain $3. It's not about zany strategies or elaborate procedures. Professional traders and financial organizations use his authorized system. He is the driving force behind the growth of various companies, including DBP, the Philippines' second-largest state-owned corporation.
Due to his strategy's effectiveness, many full-time traders have joined the program with little to no prior trading experience and emerged successful.


Best Forex Broker
Conclusion: Williams Percent Range
The Williams % R trading approach can be successful, especially when utilized correctly. However, remember that it does not indicate the market's direction, so it performs better when used with another indicator, such as the Moving Average or Relative Strength Indicator.
Depending on what you hope to gain from your investment and how much risk you're willing to take, you can adjust the Williams % R to match your trading strategy better.
Williams Percent Range FAQs
Is Williams Percent Range Indicator Profitable?
The Williams Percent Range Indicator is a tool that traders utilize to gain an edge in the market. While it is not guaranteed to be profitable, it can be used as part of a larger strategy that includes other technical indicators and fundamental analysis. In addition, it can be used with other technical indicators to help identify entry and exit points in the market.
What is the fast stochastic oscillator?
The stochastic oscillator is similar to the Williams % R, and people sometimes mistake one for the other. This is because it is a special case of a stochastic indicator that swings between 0 and 100, while most others don't.

