
Want to jump straight to the answer? The best forex broker for traders is Avatrade
The #1 Forex Trading Course is Asia Forex Mentor
Part of becoming a successful trader in the global foreign exchange market centers around is being able to analyze and evaluate forex charts. The trader then uses that information to make knowledgeable trading decisions.
It can however prove challenging to read the charts. That is why you need the right training mentor and training course. For that, we've got Asia Forex Mentor Ezekiel Chew, a world-renowned trader who has mentored everyone from retail traders to financial institutions.
In this post, you will learn the different ways to read forex charts and how you can use the information to make better trading choices.
8 Ways to Read Forex Charts
When and how should I start or cease trading activity to maximize my profits while minimizing my losses? That is the problem that every money trader is asking himself. Fortunately, most candlestick charts contain a wealth of resources to assist you to answer this question. A trader just has to become proficient in reading forex charts.
There is, however, a slight pothole. There is no such thing as one chart reading strategy that is perfect, free of risk, and perfectly accurate all of the time. The market today is so intricate that the trader can't simply rely on a single chart reading approach or a single indicator to get great results every time.
Numerous different models and variables are available in the financial markets, resulting in an intractable problem when it comes to live trading.
However, through listening to and interpreting the candestick charts, a trader may discover highly significant factors affecting the opening and closing prices change.
Simply stated, the ability to correctly interpret a forex chart will enhance your predictive skill.
The centerpiece of this forex charts tutorial is our analysis, which we will discuss in more detail in the remainder of the post. In order to properly interpret trading charts, you must understand basic technical analysis.
#1. Assess The Support and Resistance
Consider this simple question when you initially take a look at a forex chart. What is the price of the instrument, and how does it perform? The knowledge of the price of that currency pair should serve as the basis for your analysis of the chart.
As a result, the first step in determining how well the financial asset performs is to look for where support and resistance levels are. The following are some of the most basic distinctions between support as well as resistance:
- Support: When the price of a currency pair begins falling, that is when it reaches support.
- Resistance: When the price of a currency pair begins to rise, this is known as resistance.
Take a look at the figure below.
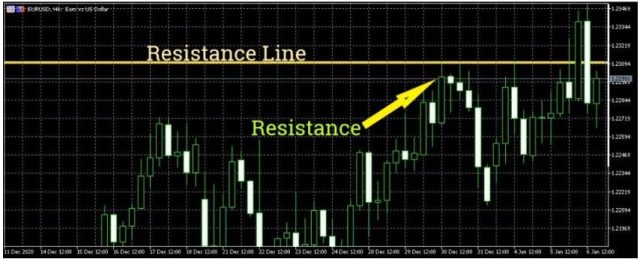
When drawing S/R lines, there is always personal judgment and subjectivity. You will draw lines where there are a series of lows or highs that come into view. You should, however, draw them with the objective of locating zones rather than precise lines in mind.
The next step is to find out the strength of support/resistance.
The definition of a support or resistance level varies from trader to trader. The most common chart timeframes for determining support/resistance strength are the 60-minute and hourly candlestick charts.
When a support/resistance area is clear across larger time frames, like the weekly or the monthly, a trader can infer that there's strong support/resistance.
#2. See the Trend
When it comes to the world of financial trading, there's a common phrase that “the trend is your ally”. Consider trends to be predictions connecting past performance to future outcomes.
Understanding how to interpret price charts is essential if you want to be a successful trader. It is a must-have if you want to succeed as a trader. It doesn't end there, though; in order to identify an emerging trend, the trader needs to also recognize when the trend is changing.
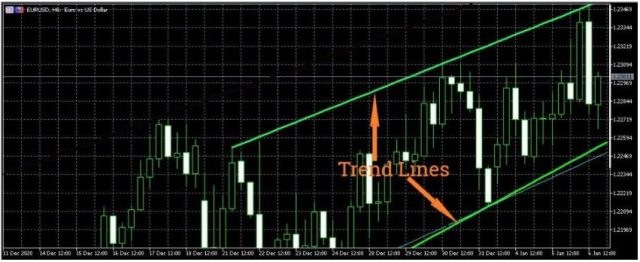
In the figure above, you can observe an uptrend in which price action remains inside trend lines.
The most valuable benefit of recognizing a trend is it allows you to choose how you will trade forex—whether short or long.
A downtrend will have typically good selling conditions, whereas an uptrend generally offers buyers.
#3. How to Analyze Forex Charts using the Three-Line Break Chart
Among the most popular methods through which you can find a trend is using a three-line break chart. It also lets you verify when there's been a shift in momentum.
This charting method aids traders in determining the trade direction, detecting a trend's peak, and selecting good points of entry and exit.
The figure below is a good example of a line break chart.
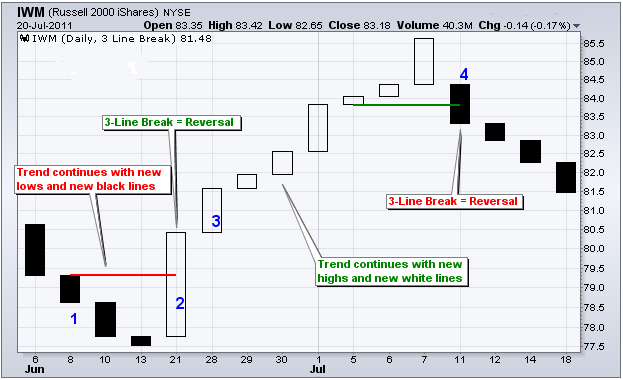
The three-line break chart, as the graph above shows, resembles a candlestick. However, there are no wicks. This is a result of the three-line chart only considering two main prices, the opening, and closing prices. When the price of currency pairs rises or falls by a certain amount, the blocks in the chart form.
The chart, therefore, is adjusted by considering the price changes rather than time.
The blocks in the three-line chart show successive highs and lows, much as they do in the two-line chart. The color of the block indicates whether prices are rising (green/white) as well as when it is declining (red/black). Chart patterns formed by the blocks suggest where the trend is heading.
It's also simple to detect a trend reversal from the chart formation. If a reversal block goes through three prior blocks, it may be concluded that a trend reversal has occurred. Some traders call this condition a three-line reversal.
#4. Spotting Micro-changes in Trends: Renko Charts
The three-line charts we've mentioned above have one disadvantage: they take time to detect trend changes.
Traders are always on the lookout for signs of significant sentimental shifts in the financial market. Renko charts overcome this difficulty by assisting you in detecting the earliest change in a trend's direction and being able to identify a bullish or bearish sentiment.
Here is a short “Renko charts” guide for beginners.
In Japanese, Renko means “brick”. Only during a price change that closes in a certain level do bricks appear in the Renko chart. The bricks will move either up or sometimes down. This is often as per price fluctuations.
Hollow or green bricks symbolize higher prices. Solid-colored or red bricks indicate price drops.
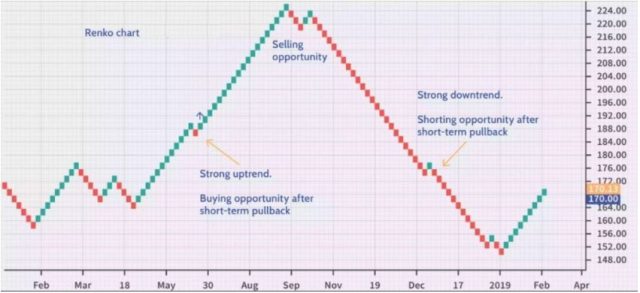
Figure 4 shows a Renko chart.
Renko charts will filter out the minor insignificant changes in price. It becomes significantly simpler to see the primary price trend by eliminating these little price movements.
To create the Renko chart, start by setting the brick size (either in pips or dollars). When the price reaches a specific amount, a Renko brick is born.
The bricks will be then produced in a sequence according to the price changes. As a result, it's simple to see when a minor trend emerges.
#5. Using Trend-Related Technical Indicators
The following stage is to examine the currency's fundamental geometry and support and resistance. This is when indicators prove handy.
Metrics are mathematical or algorithmic techniques that smooth out price data. Indicators can assist confirm such events as:
- The trend's strength
- Strength in support/resistance
- Signs that a trend is weakening or that support/resistance is breaking down
- Volatility
Technical indicators are used to try to remove the noise from price movement and find inner candlestick patterns as well as harmony in price fluctuations.
There are a plethora of signals. There are plenty of indicators available, and they all seem to be important. Ironically, the majority of the indicators aren't particularly helpful when it comes to currency trading in truth.
As a result, we'll go through one of the most important indicators that aid forex traders in determining the state of present market trends.
#6. Moving Averages
The moving average is among the most critical indicator for analyzing the trend. Let's find out how you can read the price charts efficiently using the moving average.
It's a fast and easy method to smooth out price movement data by taking the closing prices for a certain number of periods and finding the average.
A Moving average indicator is represented by a line superimposed over the price movement in the figure below.
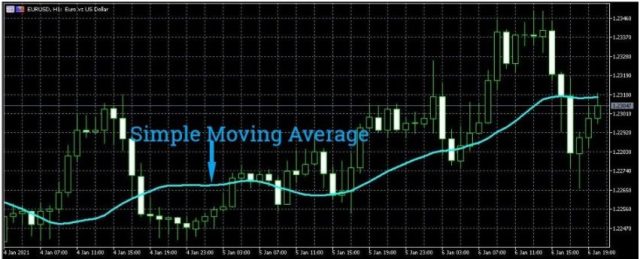
In an upswing, the price action of the particular currency pair tends to stay above the line (moving average). During a decline, the price will be beneath the line.
Among the most frequently used moving averages are the exponential moving averages and the simple moving average. The simple moving averages are often vulnerable to showing spikes. It may also offer more false signals, whereas the exponential moving averages attempt to compensate by placing more emphasis on recent price movements.
To assist forex traders to improve their trading outcomes, various types of moving averages, such as the adaptive and weighted moving averages, have been developed.
Regardless of which moving average you pick, consistency is critical. You will, with time, enhance your technical analysis and interpretation skills when you learn how to evaluate the forex chart and use the indicators consistently.
#7. Mapping Out Support and Resistance: Fibonacci levels
Leonardo Pisano, an Italian mathematician in the 13th century, discovered that all things in nature, architecture, the cosmos, and biology, have a sequence of numbers that has distinctive ratios as well as mathematical properties.
What we now know as the Fibonacci sequence was derived from these numbers, and their widespread usage extends to the financial markets. The prices in these markets are shown to fluctuate between support and resistance in response to the Fibonacci numbers.
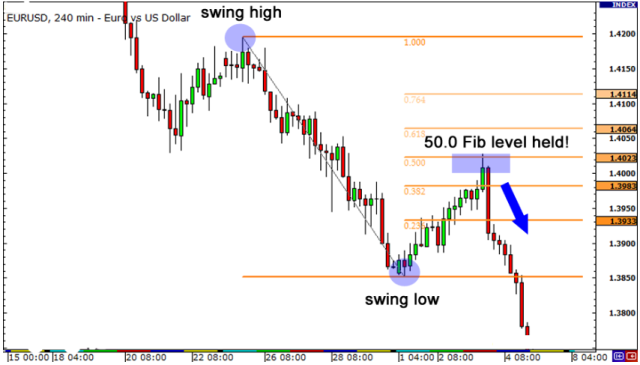
The Fibonacci grid comprises vertical lines that connect high levels on a chart to low points (and vice versa) resulting in retracement levels based on the Fibonacci sequence. The horizontal lines of the grid will show various ratios.
The Fibonacci ratios 23.6%, 38.2%, 50%, and 61.8% are the most important ones. The Fib levels are frequently used to describe the ratios.
A trader may utilize Fibonacci levels when trying to identify likely support or resistance points as well as likely points of price reversal. The basic notion is when the price comes to a certain Fib level, it receives resistance or support.
The trader should be cautious not to rely on Fibonacci levels as a predictor of the price movement though. They are simply indications of potential resistance as well as support areas.
#8. Time Frames
If forex traders can spot a developing trend and structure their trades according to it, they can consistently profit in the forex market. In a nutshell, you must know when to get into and out of a trade position based on the current trend. This simply implies that you must select the finest time period for your trading approach.
Trading candlestick charts or bar charts are based on different timeframes. You'll discover that you have a lot more timeframe options than you'll ever utilize. Fortunately, all you need to do is select only the time period that matches your trading strategy and personality.
To figure out which time period is ideal for you, consider the following questions:
- How much time do you have available to trade actively?
- How long do you want your cash to be exposed to the forex market? How long will you keep your open positions?
- What is your personality like? Are you someone who can be patient and wait things out? Do you enjoy the rush of fast, high-volume trading?
Based on your answers to the preceding questions, you have the option of trading on a long-term, short-term, or intraday time frame.
Long-term time frames are for traders who keep their open position for longer durations, which might range from a few weeks to several months or even years. These traders will focus on monthly, weekly, or daily charts. It goes without saying that patience is required while using these timeframes. On the other side, these timeframes provide the trader
Swing traders like to trade in the short term, with timeframes that last for hours to a week. As a result, the bar charts favored by swing traders are mostly the hourly time period.
Intraday traders rely on minute bar charts, such as 30-minute, 15-minute, and even 1-minute charts.
Longer timeframes generally provide more reliable signals than shorter timeframes. There is a significant increase in noise and false moves as the timescale shortens. As a result, it's simpler to spot the dominant trend when the time frame is longer.
However, smart traders keep an eye on a variety of timeframes. They check out the long-term time period to see if their theory about the current trend is correct. The short-term time period, on the other hand, aids in making entry and exit decisions.
A cautious trader may also seek to identify trend possibilities with the highest chances of success by being able to trade various timeframes. A daily trend, for example, might be aligned with one's self.
Trends observed on different timeframes may be used to verify trading decisions.
Best Forex Trading Course

To help you learn all you need to about the forex market and read forex charts, you may want to check out the Asia Forex Mentor course.
The trading strategy taught in the Asia Forex Mentor One core Program is backed by mathematical probability. It was developed by Ezekiel Chew, a world-class trader, and mentor who has taught retail traders to banks and financial institutions.
Ezekiel Chew is known for making 6 figures in each trade. His one core program is for everyone whether you are a beginner or an advanced trader. And the best part is that it is a complete program that also gives you access to the live trading room where you can watch Ezekiel execute trades live.


Best Forex Brokers
Conclusion: Ways to Read Forex charts
In this lesson, we've looked at how to read price charts. We went through the main parts of reading your trading charts, including trends, trend-related indicators, support and resistance, and timeframes.
You can now begin simulating and predicting what might really happen once you place your trade after learning about these fundamental chart reading techniques.
You may become a better trader as you read and evaluate more trading candlestick charts.
Remember, becoming a successful financial trader isn't something that happens overnight; it's a journey of learning and self-discovery.


