Want to jump straight to the answer? The best forex broker for traders is Avatrade
The #1 Forex Trading Course is Asia Forex Mentor
If you’re reading this, you must have a passing interest in forex trading. And that’s great! Forex trading is a fantastic way to make money – but it’s not easy. In order to be successful, you need to have the right tools and knowledge at your disposal. And one of the most important tools in a forex trader’s arsenal is the Vortex Indicator.
Vortex Indicator is quite a new tool that is highly preferred for estimating the market situation. This tool was created by Etienne Botes and Douglas Siepman, two great market technicians based in Switzerland. The idea of borrowing the notion of vertical movement in both directions in the financial markets was inspired by vortices that form in water.
This indicator is unique because it uses the vortex concept to estimate market trends and their direction. For further understanding, we have got Ezekiel Chew to share his knowledge and expertise on this indicator.
Ezekiel is a highly respected figure in the forex industry. He is the founder and CEO of Asia Forex Mentor, one of the world's most successful forex education companies.
In this guide, we’re going to take a comprehensive look at the Vortex Indicator — what it is, how to calculate this indicator, its limitations, and more.
What is Vortex Indicator
The vortex indicator may feel like an easy tool, but that's not the case. To understand it well, let's first start with the definition.
A vortex indicator is an oscillator used to identify the market trends' beginning and end. Likewise, other indicators use historical price data to predict stock, currencies, and commodities price trends.
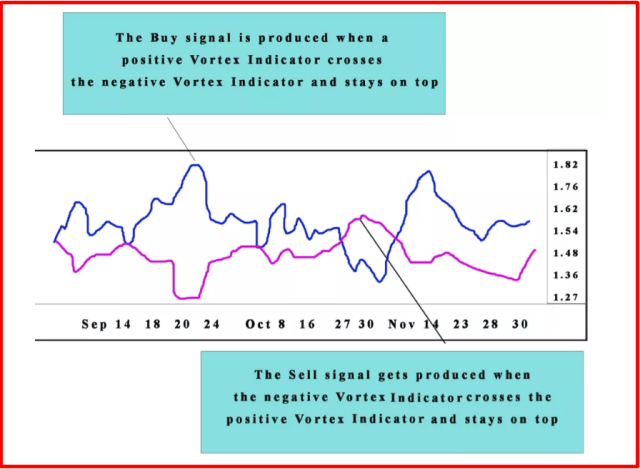
This indicator is made of two lines on a price chart that fluctuate up and down in terms of trend and signal good or bad market movement. When the lines cross, the market becomes more bullish. This indicator has a bias, meaning there is no neutral position; it can be bearish or bullish.
To form the indicator, look at the previous two day’s highs and lows. The present high to previous low interval marks positive trend movement while the present low to previous high interval marks negative movement.
The length between two numbers on the line indicates the trend's potential. A longer length means a stronger positive or negative trend movement, while a shorter line reveals a weaker trend that can be either negative or positive.
How to calculate the Vortex Indicator?
The Vortex Indicator is calculated using the formula divided into four phases. The initial step is the ‘True Range.' Then, to estimate the rate, subtract the present low from the present high and compare that to the difference between the present high and preceding close, as well as the present low minus the preceding close. Whichever value is largest indicates resistance.
This next step looks at both the positive and negative movements. The former has the entirety of the current high subtracted by the previous low. At the same time, the latter simply reverses that ratio to get the value of the present low minus the previous high. The third step is to determine the length of time, usually two weeks to a month. You use this time to consider the whole range and any positive or negative momentum.
To calculate the TR over a period of time, n, use the positive momentum formula to get TRn. To find VM+n, you need to know the VM- over the length of n, equal to VM-n. Then calculate the TR over the length of n to get TRn, the positive momentum over n to calculate the VM+n, and the VM- over the length of n to get VM-n. The final step in the formula is to divide VM+n by TRn to get VI+, and similarly, divide VM-n by TRn to get VI-.
It may appear not very easy, yet the vortex indicator formula is pretty simple. The trading software usually does the calculations for you, but recall that it isn't available on many platforms, and it might be advantageous to lar the calculation.
Vortex Indicator Limitations
The vortex indicator has advantages for traders, but it also has some disadvantages, the most significant of which is that it only displays the market's current condition and can't predict future changes.
The best investments are always quality research-based. The price might move higher or lower, but its past performance never indicates future outcomes. A vortex indicator can give false readings, especially in shorter periods. This is simply due to the way it measures market oscillations.
The indicator is still young and has not been subjected to extensive testing. Therefore, when compared to other tools, the expertise is modest. However, in analyzing market data, it might be useful; nevertheless, it must always be used along with additional technical indicators.
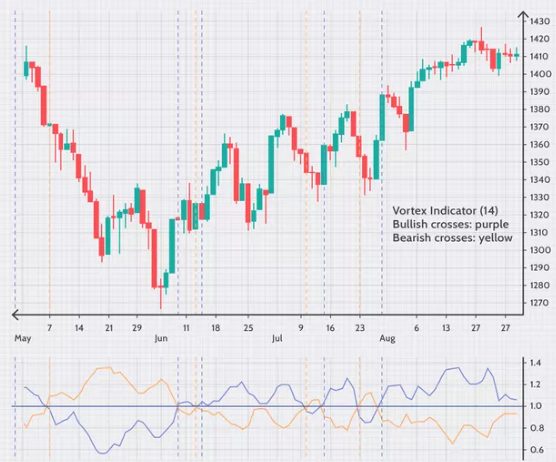
Confirming the current trends on Charts with Vortex
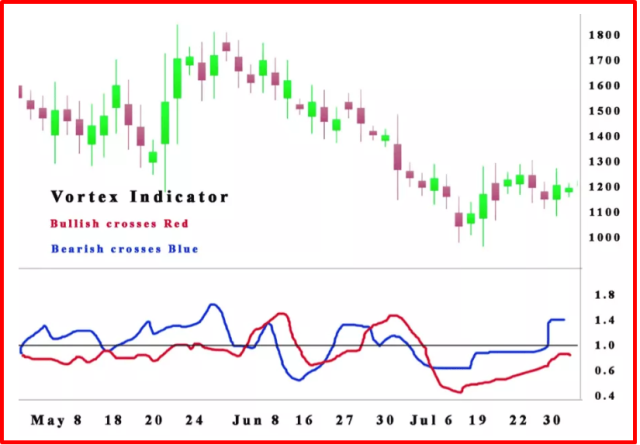
The first step in trading and interpreting charts to determine the market's position is to look at the chart and acquire a visual representation of price movement. The next step is to add the vortex indicator to the chart.
You can check the default indicator period, which is typically 14. Yet, you have the choice to modify the trading strategy.
The vortex indicator accomplishes this by drawing a horizontal line at number one, which serves as the center line. Then, depending on whether the positive or negative line is longer, you may anticipate an increase or decrease in price. Prices are more likely to rise if the beneficial line is longer than the unfavorable one.
Vortex Indicator with Technical Analysis
The main goal of the vortex indicator creator was to produce a tool to eliminate false signals. With the vortex indicator, the anticipated entry price is a crossover, which occurs when the bearish market and a new bullish market sentiment transition.
It is possible that the objectives can't be met simultaneously as the indication revealed, thus encouraging a sell or purchase order that stays active for several sessions if necessary.
When utilized during a transition, the major high or low becomes a level of reverse activity and a stop. The short sale will be protected when this trading method is used and will return to the long side when the price resumes to its extreme high after crossing on the plus side.
After the price has returned to the major low following a crossover with negative characteristics, it may be sold on the market and turned into a short sale. Combining the beginning with various strategies for managing potential risk levels to minimize losses is critical.
By implementing these precautions, you can prevent false signals and make a profit off of the current trend. These are to be used when significant momentum has not yet been reached. However, the approach doesn't account for somebody's plan to stay, resulting in a continuous stream of false alarms.
Best Forex Trading Course

Asia Forex Mentor is one of the most credible forex trading courses available today. It is headed by Ezekiel Chew, a trader making six figures per trade for over a decade. The trading methods are backed by mathematical probability and the trainer behind banks and trading institutions.
AFM PROPRIETARY ONE CORE PROGRAM is the core program that covers from beginner to advanced, and every segment must include the above points. The program is designed to make you confident and earn as quickly as possible in live markets.
It starts with the basics of forex trading and moves on to more advanced topics such as risk management, market analysis, and trade execution. The course also includes a live trading session where you can see the techniques being applied in real-time. If you're serious about learning forex trading, sign up now!


Best Forex Brokers
Conclusion: Vortex Indicator
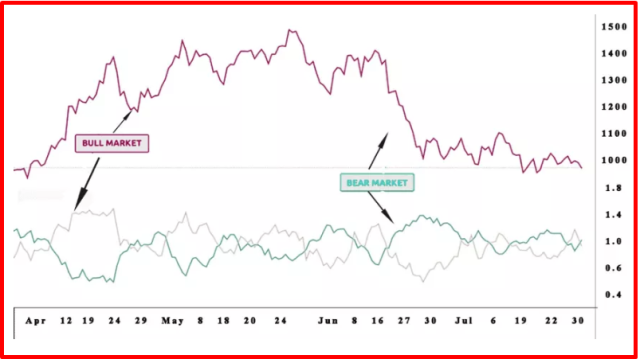
The vortex indicator is based on previous work by J.Welles Wilder, but it isn't entirely original. A trend-following indicator builds from two oscillating lines that follow the market's price bars to identify significant trend change moments. Solid entry points are revealed when the lines converge at specific locations.
This directional indicator is quite beneficial for several trading strategies as it offers signals and trend reversals. Along with that, it can be used for different timeframes and different markets. But, the most interesting part is that it is applicable to locate much larger trends in the weekly charts. These weekly charts are further used to locate the trend details.
Analysts should pay close attention to the vortex indicator when working with a daily chart since it indicates an upswing. Moreover, it can also be utilized for bearish signals.
The vortex indicator is not without its flaws, as it can give false readings, especially in shorter periods. Nevertheless, implementing this tool with other technical tools like MACD, RSI, and moving averages will smooth out the indicator's readings and prevent false signals.
Vortex Indicator FAQs
Is Vortex Indicator a good Indicator?
The Vortex Indicator is a good indicator for those who want an idea of the market's current condition and don't mind its lack of predictive power. However, it's important to remember that the indicator is still young and has not been extensively tested. As such, it should be used in conjunction with other technical indicators.
How can Vortex Indicators prevent false signals?
The traditional applications produce a large quality of false trade signals, and vortex indicators prevent false signals. It is done using a crossover, which occurs when the market transitions from a bearish to bullish sentiment.


