Want to jump straight to the answer? The best forex broker for traders is Avatrade
The #1 Forex Trading Course is Asia Forex Mentor
The purpose of this post is to expound more on the Trix indicator. Confidence in an investor is one inevitable way to increase your odds of making decisions that win you big opportunities. And the lenses to achieve that include indicators – which help you figure out what the charts are saying as regards price action.
Therefore, over and above the knowledge of indicators, it’s far more important for an investor to internalize the performance metrics of any indicator. Additionally, having a clear grasp of the market conditions, plus the situations a specific indicator may give wrong signals.
While focusing on adding value to this post, we have deliberately sought out the insights of Ezekiel Chew regarding the use of the Trix Indicator. Ezekiel is an established financial markets investor and a key proprietor of the Asia Forex Mentor – which is a form of his giving back to society.
Along the discourse of this post, readers will get in-depth explanations of what the Trix indicator is. Other than the pros and cons of Trix, there’s a key section on how Trix is calculated and the way it triggers the trading signals. And a key supplement to the situations where Trix lacks market signaling.
What is The Trix Indicator

TRIX is an acronym – or letters that represent a set of words. So TRIX stands for the triple exponential average. Some traders also refer to it as the Triple EMA.
Expert investors categorize TRIX among the momentum indicators. More specifically, investors use TRIX as part of their technical analysis.
At any moment, TRIX shows the percentage changes in moving averages that have undergone exponential smoothing three times.
There’s a key reason why TRIX inherently works with exponential smoothing. Exponential smoothing in statistics helps remove smaller and irrelevant trends. So in trading chart trends – smoothing helps by filtering away trends that have little or no significance.
The trends and signals that the TRIX indicator generates have a high level of similarity with what the MACD or moving average convergence divergence indicator generates.
Here are three specific notes with the Trix Indicator
First, TRIX, or the triple exponential average indicator, works as a graphical oscillator. And as a momentum indicator, TRIX helps investors spot situations when an asset or stock is either overbought or oversold.
Secondly, with the aspect of triple smoothing, the moving averages generated confirm firmer trends.
Thirdly, experts guide that traders observe when the TRIX indicator crosses the zero line. A cross to the upper of the zero line indicates a buy signal. And of course, when TRIX crosses to the lower side of zero – it is a sell signal.
Benefits of Trix Indicator

Triple EMA is a technical analysis indicator that comes with several advantages. Next is a list of them:
Firstly, Trix as an indicator is a part of the default tools inbuilt in most trading software. And that means it’s easy to access – investors do not require paying other developers or installing any software add-ons.
Secondly, the formula and calculations behind the indicator are relatively simple. Therefore, the simple background of the data and calculations to arrive at the exponential add to an insightful way to chart and market analysis.
The third advantage of Trix comes from the relative ease of application. In comparison, Trix is easier to use in comparison to other complex indicators.
The fourth advantage of Trix is – it applies to any chart and asset on the financial markets.
And lastly, Trix is an ideal indicator for fitting into trading strategies that build on trading two models. One is price breakouts, and the second is moving average divergences.
Disadvantages of the Momentum Indicator
Investors need to be aware of one generic problem across indicators that appear in the form of oscillators.
And the key problem is consolidating markets or range-bound trading. It’s the scenario where price action lacks clear trends or trading sideways.
The main disadvantage with Trix starts when the three MA’s or moving averages entwine. In simpler terms is when the MA’s lines coil – in a random fashion.
So, the coiling or overlapping brings about a mix of signals. And in instances of slight clarity of a signal, it may not be a substantial move.
Therefore, the lack of clear trends confuses signals with the Trix indicator – worse when some are false breaks.
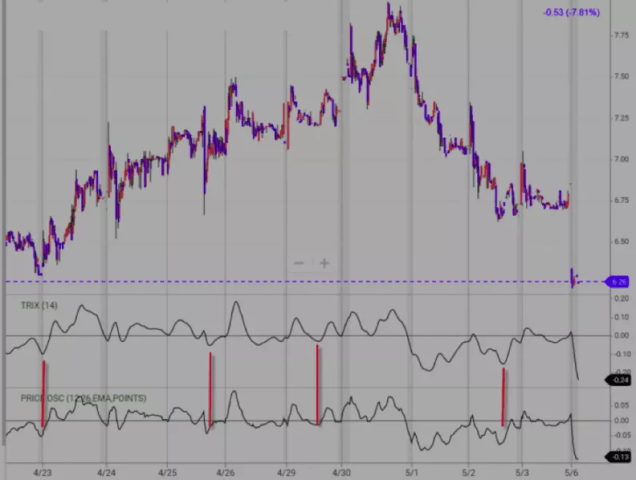
Trading TRIX Indicator Signals
It goes without loudly emphasizing that the success rate of strategies trading with the Trix indicator highly depends on the insights and efforts of a trader at spotting the correct signals at the right moment – timing.
Essentially, there are three key signals a trader requires to grasp with TRI as an indicator.
One – Zero Line Cross
TRIX indicator helps traders determine if there are any impulses building up within a market. So with the centerline taken as a general average – it reads zero (0).
Tentatively, when values cross the center line from below – it indicates bullish momentum, and traders look for buy opportunities.
The reverse also applies – a cross of the EMA’s from above the center line – 0 indicates a build-up of bearish scenario – so traders look for sell opportunities.
Two – Signal line cross
To increase the odds of spotting a good entry position, traders add a signaling line to the TRIX indicator. Since the signal line is also an exponential moving average, it tends to lag behind the indicator.
Therefore, for buy signals, the signals line has to cross the signal side from the lower side. Similarly, sell signals arise when the signal line crosses from the upper part.
And both signals above – buys and sells apply for either ranging and trending price action. However, there’s more insight regarding whether market trends or consolidates.
First, for trending markets, when the signal line makes a cross, it points towards an end in the retracement of prices. So, the prices will tend to resume back into the longer-term trend.
Secondly, for markets that are ranging, the signaling line helps traders confirm that a market has retained the applicable zones of support and resistance.
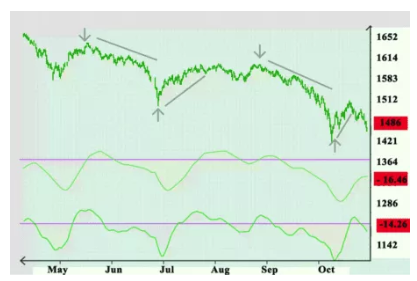
Three – Divergences
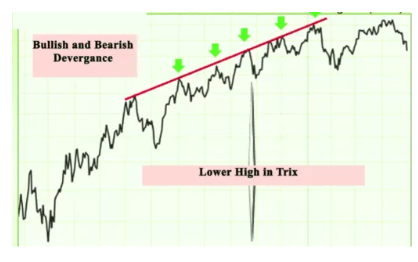
Trix can also help traders with the identification of potential areas where the markets are likely to make turnings.
And to spot the significant turning points, traders have to look at the divergencies in the markets.
To make things clear, a divergence happens whenever the prices move in the opposite direction of a TRIX indicator.
If we put it in a clearer scenario – prices keep making higher highs while the TRIX indicator makes lower lows. It indicates the uptrend is getting weaker over the consequent timeframes. And most likely, a bearish reversal would most likely follow after that.
The other way around also holds true with regard to divergencies. Ideally, TRIX scores higher lows while the price makes lower lows in the charts. It shows a build-up of bullish momentum (Bullish reversal likely to happen)
Notably, the divergencies – both bearish and bullish take place when the asset prices and the Trix indicators fail to confirm themselves.
Bullish divergences may take place after prices move to lower lows – while TRIX shows higher lows. Therefore, the higher low shows slowing downside momentum and will most likely be a precursor for bullish reversals.
Bearish divergences also occur with asset prices scoring higher lows. At the same time, the TRIX indicator shows lower highs. So, the lower high indicates weakening bullish momentums. And may also foreshadow bearish reversals.
In most instances, Bearish divergences are not so clear with massive uptrends. Momentum may still break further upwards even in instances where the oscillator is above the signal line.
And lastly, divergencies work well with the TRIX indicator. But the best insight with Trix crosses lies with spotting a correct signal.
TRIX- Triple Exponential Moving Average Calculation
TRIX calculation simply does smoothing three times -hence the naming – Triple Smoothing Exponential average.
As a matter of re-emphasis, smoothing brings preciseness by removing the minute noises from a trend. And as well, comprising moving averages that are exponentials ensures only more weight to the most recent data.
Of course, what matters to investors is the most current price or data. Plus, EMA’s pull more weight to the most current price. As a drawback, simple moving averages or SMA’s give equal weighting to all periods or timeframes – which has a drawback by attaching equal weights to past and irrelevant investment timeframes.
Additionally, a trader can adjust the EMA’s to precisely suit their investment needs and insights.
To calculate the triple exponential moving average, the following formula applies:
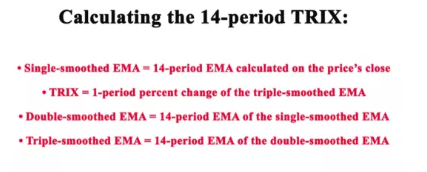
- Firstly is the Single-smoothed EMA. This is given by the last fourteen (14) periods of Exponential Moving Average. The EMA calculation comprises the latest period’s closing price.
- Secondly is the Double-smoothed EMA. This is given by the last fourteen (14) periods of a single smoothed Exponential Moving Average. The EMA calculation comprises the latest period’s closing price.
- Thirdly is the Double-smoothed EMA. This is given by the last fourteen (14) periods of double smoothed Exponential Moving Average. The EMA calculation comprises the latest period’s closing price.
Finally, TRIX is taken as 1 (One) minus the percentage of change if the triple-smoothed exponential moving average -EMA. Finally, the technical indicator shows a negative value and a positive value.
Best TRIX Combinations

Trix indicator works well with tracking market momentum with respect to price action.
However, trading competency requires the inclusion of other metrics. A good example is the volumes of trading with respect to a target asset.
Therefore, we’ll cover two combinations that help fix the fallacies with Trix as an indicator.
Triple Exponential Average Trix Plus MACD
Moving Average Convergence Divergence or simply MACD is an indicator of market momentum. Additionally, MACD is a trend-following indicator -meaning it gives very reliable signals while markets have clear market trends.
Investors have a good chance of analyzing markets with a combination of the MACD and TRIX. In summary, the combination helps with clearer signals. Clearer signals with trading help when new trends take shape. Plus, traders know when to exit a trade when the trend breaks.
In matters of applicability, the following combination helps filter out false breaks and leaves you high potential entry opportunities. One is when the TRIX indicator shows a crossover against the signal line. The second is the crossover of the signal over the MACD histogram.
TRIX (Triple Exponential Moving Average) Plus RSI
Relative Strength Index or RSI helps you measure the momentum of a trade. Additionally, RSI also tracks the power of a price trend.
A merger of TRIX and RSI offers an excellent confirmation for buy and sell signals. Working with both can help traders within a choppy or sideways market.
For instance, a great buy signal confirmation with both indicators RSI and TRIX showing oversold states. It can help a reversal trader ride the markets for an impending bullish break.
Best Forex Training Course

There is no doubt all these things may seem a bit technical to follow. In fact, the price makes so many wild swings each day that it can be very hard to measure buying pressure or selling signals. Also, learning all the technical analysis you need for forex takes more than just a day. Instead of relying on the odd article here and there, you may want to get a full detailed course to take you through all these situations.
Here is where the idea of the Asia Forex Mentor by Ezekiel Chew comes in. The course is a robust introductory guide that will give you the knowledge you need to trade forex. It's a beginner-friendly guide as well that works for folks who want to trade forex and any other financial asset.
The Asia Forex Mentor will not just teach you how to predict price shifts, daily volume, and these other technical indicators. It will also teach you how to manage capital and explore some of the most advanced risk control measures in the world. After all, as long as you are managing your capital correctly, identifying overbought and oversold pairs will be the easier part.
Also, if you are an advanced trader looking to learn some of the tricks used by leading banks, this course is also ideal. As a matter of fact, The Asia Forex Mentor is developed by someone who has taught some of the leading investment bankers how to trade forex. You will be able to identify a losing trade, gauge price movement under immense trading pressure, and maintain a level head even when the markets are volatile.


Best Forex Brokers
Conclusion: Triple Exponential Moving Averages Indicator

TRIX is a momentum indicator. It works with exponential moving averages that have been smoothed three times. Exponential smoothing helps with showing the main trend after filtering out small irrelevant movements.
One advantage with TRIX is it comes as s freely inbuilt component of most trading platforms. However, it has a huge drawback when markets consolidate – the 3 EMA’s coil up, showing a mix of poor signals.
Lastly, the best way to analyze markets with TRIX is by combining it with another indicator to help filter false signals.
TRIX Indicator FAQs
Is TRIX a Good Indicator?
Trix is a good momentum indicator. And to best get trading signals, it is okay to combine them with another indicator – like the MACD histogram or the RSI.
What is the TRIX Stock chart?
A Trix stock chart indicates the rate of change in the triple exponentially smoothed moving averages. It shows as a percentage.


