

Want to jump straight to the answer? The best forex broker for traders is Avatrade
The #1 Forex Trading Course is Asia Forex Mentor
For evaluating the state of the market and identifying trading signals, Dean Malone created the Traders Dynamic Index (TDI) indicator.
Among the know-how recommended by Ezekiel Chew, a stalwart trader is adopting the Traders Dynamic Index (TDI) indicator.
A flexible trading indicator is the Traders Dynamic Index or TDI. This is called a hybrid indicator because it incorporates moving averages, volatility bands, and the relative strength index.
This review is, however, targeted at throwing light on the use of the TDI indicator, especially for beginners in finding appealing entry points and defining the market's structure.
What is TDI Indicator
The Traders Dynamic Index (TDI) provides traders with a comprehensive view of the state of the foreign exchange market using the relative strength index (RSI), its moving averages, and volatility bands (based on Bollinger Bands). The (TDI) indicator focuses on market patterns, volatility, and strength. It's widespread as many forex market traders find it sufficient to develop their entire trading strategy.
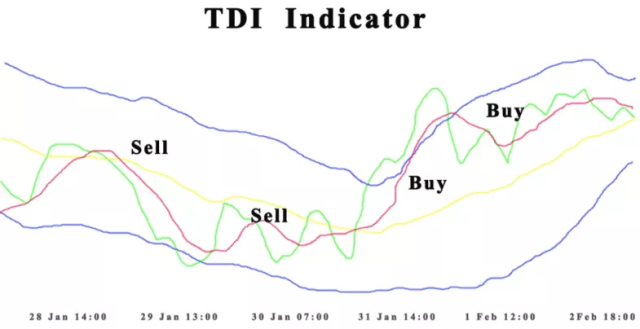
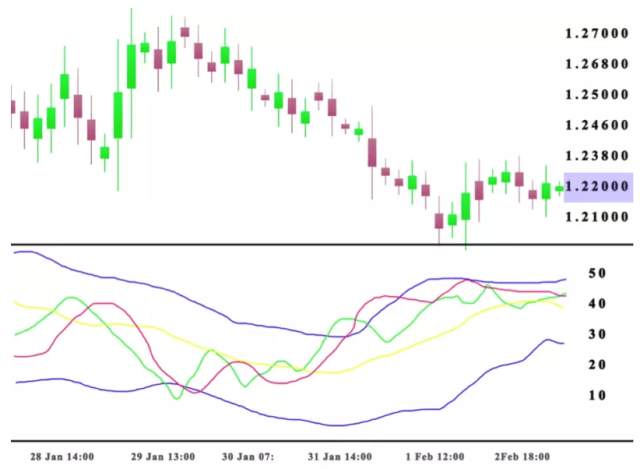
Two RSI lines and three Bollinger Bands make up the TDI, which is depicted in a window underneath the price chart. The red RSI line, calculated using a longer averaging period, is referred to as the signal, and the green RSI line is called fast. The RSI lines indicate the market's strength and volatility. They send out short-term TDI signals when they cross.
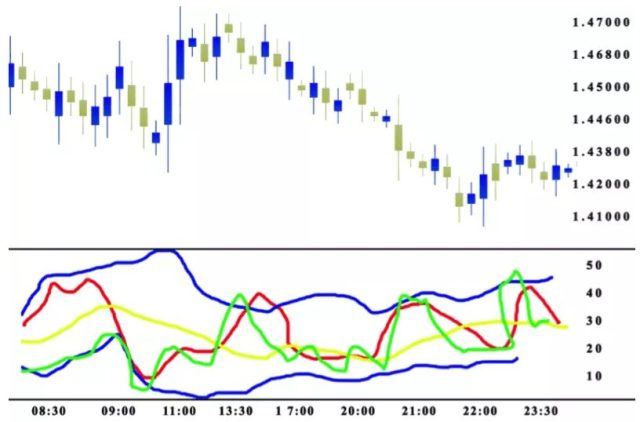
The Bollinger Bands consist of two blue bonding lines, while the yellow line is referred to as the middle or main line. Level 50 is the indicator's central axis, and levels 32 and 68 are also indicated. According to the traditional RSI, the overbought zone is above 68, and the oversold zone is below 32.
Market reversals are defined in part by levels 68 and 32. A local bottom in the market develops when the yellow line crosses level 32 downward. Level 32's successful upward breakaway denotes a turnaround or the start of an ascending corrective. The market experiences a local high if the yellow line crosses over 68. A breakaway from this level downward indicates a reversal or the start of a descending correction.
Practical Remarks about TDI
Although the TDI indicator has a complicated collection of lines, traders shouldn't be discouraged from utilizing it because every signal can be interpreted straightforwardly, making it helpful for newcomers.
A trader can use up to three indicators to analyze a chart in day trading, but doing so might sometimes be confusing. At this point, the TDI comes into play, providing the trader with a thorough understanding of the markets. As a result, the complexity is decreased by using only the signals from one indicator.
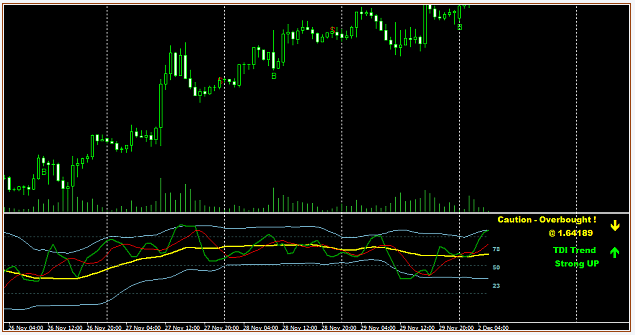
Blue lines; when expanding, the market is strong and trending. When constricting, the market is weak and in a range. When the blue lines are incredibly tight in a narrow range, expect an economic announcement or other market condition to spike the market.
How to configure TDI Indicator
Many options are available for dynamic index indicators. It may be highly customized because of this. You can use your custom settings or go with the default ones.
For the RSI period, the preset setting is 13. This specifies how many spikes the RSI will be based on. The RSI would start to delay if you set this to a more excellent value.
The TDI may also become a little oversensitive to changes in the market if the setting is too small. Finding a level that works for you while using the RSI indicator alone is one of the best approaches to determining the level you should utilize.
The Bollinger bands are set according to the volatility band setting. 34 has been selected as the standard. On the other hand, you would need a value of 21 if you were employing the Bollinger bands alone.
As a result, this parameter can also be customized, and the quantity you decide on will be a function of how acquainted you are with the signal. The volatility band can become more sensitive if the settings are changed to a lower level, so keep that in mind.
Trading Signals generated by the Green line
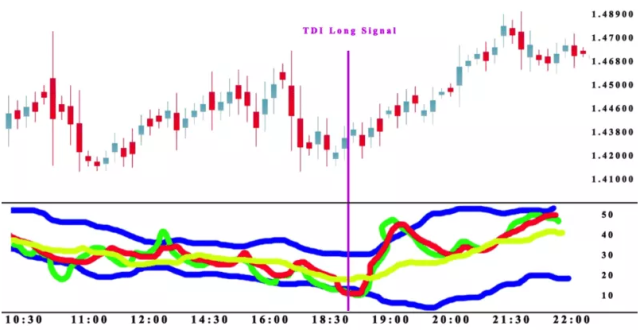
Waiting for the green line to cross above the yellow line on the price chart is one of the requirements for a valid trade signal. When this occurs, the short-term trend and the long-term trend are in alignment.
When the green line crosses over the yellow line, it indicates that buyers are in the market and that we are getting anxious.
Scalping opportunities are at an all-time high when the momentum is aligned.
The trick is that the blue Bollinger Bands must cover the red line for this to work. We can tell the market is picking up speed when the red line crosses above the upper blue band. This indicates that volatility has increased, which suggests that traders have run out of steam.
Making the TDI Indicator more Sensitive explained
Have you ever quit a trade but then wished you hadn't? Making your TDI indicator more sensitive would be a trading system, not just a strategy. The difference is that a system is an entire trading methodology, whereas a strategy is only a set of rules.
The signals are separated into buying and selling categories for scalpers. The green line crossing the red line from the bottom up is the signal for purchase. However, the intersection must cross line 50 of balance.
When the green line crosses the red line from top to bottom, it is time to go short. The yellow line support should point below the 50 levels.
Making the TDI indicator more responsive to the current market circumstances makes trade implementation easier.
Best Forex Trading Course

Ezekiel Chew is a professional forex trader and trainer. He is the founder of Asia Forex Mentor, one of the largest forex education companies in the world. He has 2 decades of experience in the forex market and is respected for his knowledge and expertise.
Ezekiel's core program, ‘AFM PROPRIETARY ONE CORE PROGRAM,' is the Complete Program, which covers everything from beginner to advanced. The program is designed to give you the best possible chance of success in the forex industry. It is backed by mathematical probability and has been used by banks and trading institutions for years.
Ezekiel is a highly credible figure in the forex industry. So, if you are trying to make money in forex trading, you should check out his program to start your forex career.


Best Forex Broker
Conclusion: TDI Indicator

The TDI indicators use three independent indicators to gauge the trend, momentum, and volatility. It also uses three different price components, so traders can experience a different kind of trading without relying on the indications from the three indicators.
Therefore, traders turned to the TDI, a customizable indicator. The TDI indicator's primary benefit is that it clears up the clutter on your charts. When you incorporate the TDI into your trading strategy, it also eliminates the need for any other indicators.
Given the extensive configuration options, traders can experiment with and become comfortable with the TDI indicator while tailoring it to their preferences. This will guarantee that the indicator is properly set up to capture the volatility of the securities and other market circumstances.
TDI Indicator FAQs
Is TDI Indicator Reliable?
Yes, the TDI is employed mainly by Forex traders, but it also works well for trading contracts for difference, cryptocurrency, and even BO. The TDI is a flexible tool that displays the status of the traded currency. As the charts for USD/CAD, Gold, and Bitcoin will differ, you must recognize these differences and adjust to the unique characteristics of each trading commodity.
How do you read a TDI Indicator?
Simply applying the regular RSI as input data for 3 distinct SMA periods with the updated values (13,2) will allow you to recreate the various TDI timeframes:
RSI Price Line for TDI (13, 2)
RSI signal line (13, 7)
Initial: RSI (13, 34)
Long Scenario
The application of normalized criteria to determine overbought and oversold circumstances is another resemblance to the RSI indicator. The TDI indicator thresholds are set to 68 for overbought and 32 for oversold, as opposed to the 70/30 thresholds used for the normal RSI. A long position is expected if the trade goes above the 50 threshold.
Short Scenario
In the short scenario below, the baseline first deviates from the 50-point mark, signaling a downward trend. The price line soon crosses below the signal line, setting up a short setup. Later, outside of the Bollinger Bands, the signal line also breaks.


