
Want to jump straight to the answer? The best forex broker for traders is Avatrade
The #1 Forex Trading Course is Asia Forex Mentor
When it comes to trading forex, traders use many strategies to try and profit from the market. Some use technical analysis, while others use fundamental analysis. Most intraday traders use technical indicators to enter/exit the trades. The most common calculations include Moving averages, Bollinger bands, RSI (Relative Strength Index), and the Supertrend indicator that Olivier Seban develops.
A Supertrend technical analysis indicator is one of the best indicators used by intraday traders as it provides precise buying and selling signals in a trending market. You can use this indicator on any timeframe from a 1-minute to a weekly chart. However, the most popular timeframes used by day traders are the 5-minute, 15-minute, and 30-minute charts. To better understand the Supertrend indicator and its calculation, we have got Ezekiel Chew to help traders with a step-by-step guide.
Ezekiel is the founder and head of training at Asia’s largest price action forex academy – Asia Forex Mentor. With over a decade of trading experience, he is one of the few price action traders globally who is consistently profitable in both bull and bear markets. Let's find out more from him.
What is Supertrend Indicator?

Supertrend is a technical indicator developed by the French forex trader Olivier Seban. It is a new system that is well-built and based on a completely new approach to technical analysis. The indicator is created to help traders make more accurate decisions by analyzing the market conditions. You can use Supertrend indicator to get the idea of strong buying and selling signals in a trending market.
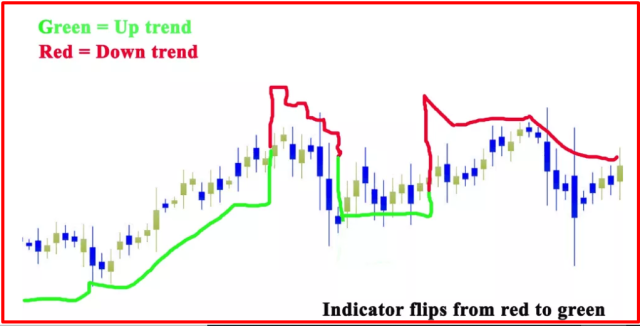
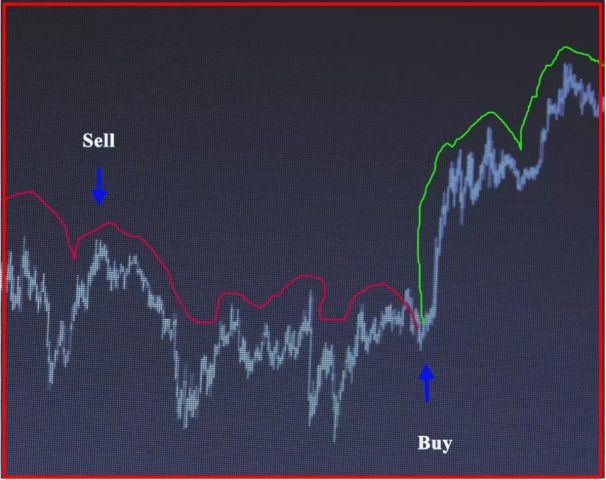
The Supertrend indicator is a trend-following indicator that is similar to moving averages. The key difference is that the Supertrend indicator uses ATR(Average True Range) to calculate the indicator value. The indicator line is plotted above or below the price, depending on the direction of the trend. When the indicator line is plotted above the price, it signals a downtrend; when it is planned below the price, it signals an uptrend.
The indicator line is colored green when the trend is up and red when the trend is down. The indicator line is considered support in an uptrend and resistance in a downtrend. You can find accurate signals on the intraday trading charts if the proper technical analysis techniques are used.
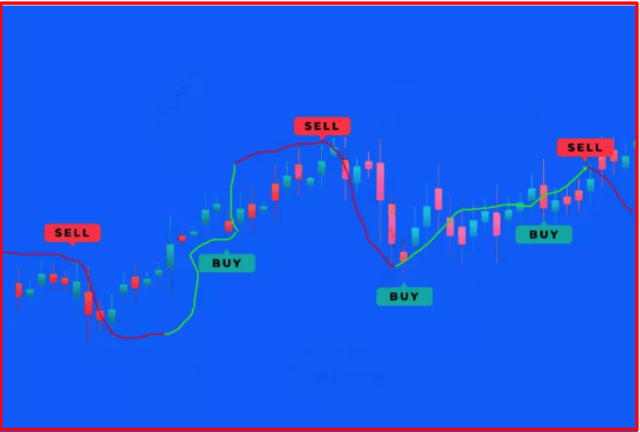
Buy and Sell Signals from the Supertrend Indicator
When implementing the super trend indicator, most intraday traders use a combination of the indicator with other technical indicators such as MACD, RSI, and Stochastic to confirm the buy or sell signals before entering the trade.
Traders must look at a chart of a specific stock they are considering and time intervals of 10 minutes when performing intraday trading. You may use good charting software to assist you with these tasks.
The default parameter is set at 10 and 3. Remember that any modifications to these values will impact the Supertrend indicator's results. Therefore, it's a safe choice to use only two parameters on a trading chart.
However, keep in mind that there is no setting for any indicator. At the same time, you can modify settings to create an over-optimized trading system for that specific point. The indicator is more responsive to price changes when the settings are smaller, resulting in more signals. Greater settings will remove market noise while risking fewer trading signals.
Inserting Supertrend is crucial because it generates the base for other indicators. The chart should be opened and the settings adjusted as follows: 10 and 3 are the default values. If you like, you can change the parameters; however, it's best to follow established methods.
When using a Supertrend indicator, don't forget to place your stop loss. For example, if you are trading a long position, you can put a stop on the green line indicator. In the case of a short position, place your stop on the red line indicator.
The simplest way to generate profit is to utilize the stop-loss pattern in conjunction with the Supertrend indicator.
Identifying a Trending Market
The best time to trade with the Supertrend indicator is during a trending market. The indicator is not useful during a sideways or choppy market as the indicator line will be flat during those times. A Supertrend indicator is a trending indicator that is quite productive in trending markets.
When the indicator turns over the closing price, it is an indication that investors are seeking. When the Supertrend closes below the price, the buy signal emerges. If it closes below the price, it is a sign of weakness in that stock and indicates going short.
On the other hand, when a superintendent closes over the price, a sell signal is given. When the indicator line is over the price and pointing downwards, it is a sign that the current trend is about to reverse.
However, no technical indicator is completely precise, and the Supertrend indicator is no different. So, while it can indicate where the market is heading, you should always use other technical indicators to confirm the signal before entering a trade.
Average True Range is Part of the Formula
When using the Supertrend indicator, you should also be aware of the Average True Range. The Average True Range is a formula used to calculate the Supertrend.
A Supertrend indicator might be easy to use but calculating it is a different story. In most cases, only clicking a symbol on the software is required to utilize an indicator. However, figuring it out and conducting the operation are two distinct issues.
The Supertrend indicator calculation requires a mathematical background, but most traders do not need to understand the calculation; nevertheless, if you want to understand it, you should learn how the results come about. The Supertrend uses an ATR indicator to calculate its value, so the equation includes the true average range (ATR). Next, append the stock's high and low prices to compute the upper band.
Here is what the Supertrend indicator formula looks like:
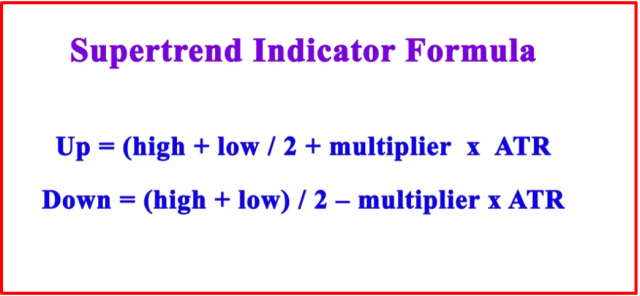
The true average range of the data (ATR) is calculated by dividing the entire figure by two and adding the multiplier and the typical true range. Simply put, it's a way to examine whether or not there has been any price volatility.
The fundamental lower band is then calculated by adding the high and low values and dividing the result by 2. Then take away the multiplier times the true average range.
Combined Supertrend with other Indicators
The Supertrend indicator strategy may be plotted on a chart and waited for a color change that indicates buy and sell signals. To avoid false signals, it's best to employ false signals in conjunction with other signs to prevent false signals. Below are a few reliable indicators combined with the best strategies to identify the precise signals.
Supertrend And RSI
The RSI indicator can be used with a Supertrend indicator to determine entry and exit points. Next, calculate the potential trade's momentum by looking for overbought or oversold signals with the RSI and a 14-day default period.
An RSI value of less than 30 is typically considered an oversold market. Conversely, a trader accepts a price of more than 30 as a buy signal.
Supertrend And Parabolic SAR
Another popular choice for combination with the Supertrend trading strategy is the Parabolic SAR. The Parabolic SAR is a stop-and-backpedal system, often called a Stop and Reverse System. A line drawn through the dots on a graph forms what's known as a parabola.
If the dots move over the current price, it is interpreted as a bearish indication; if they go below the current price, it is considered a bullish indication.
When combining both indicators, you should use them as a pair of complementary tools to examine various information. The pair is ideal for short-term traders since they evaluate distinct data. Follow the Supertrend line's precision when using both indicators on a chart; compare it to Parabolic SAR to assess the accuracy of buy and sell positions.
Supertrend And MACD
The Supertrend indicator is combined with the MACD to create a useful technical analysis tool. The MACD works best and displays upward movements by going over the zero lines, which investors regard as a buy signal.
A sell signal is indicated by the MACD line below the signal, indicating a downtrend. Compare the hue of your Supertrend line to that of the MACD trend to confirm entry and exit points. These two indicators work together to provide the quickest technical analysis in a daily chart.
Best Time for Supertrend Indicator
The Supertrend indicator is the most versatile trading strategy that can be used in any time frame; however, it's most commonly used on intraday charts. When using it on intraday charts, it's best to use a 5-minute or 15-minute time frame.
In addition, the best time to use a Supertrend indicator is when there is a powerful uptrend or downtrend, as it helps to find the entry and exit positions.
When day trading and using the Supertrend indicator, implement trading scams that employ it and keep track of short time intervals of 5 to 15 minutes. The Supertrend indicator is adaptable and may be utilized on several different timeframes by day traders.
Pros and Cons
Pros
- Supertrend produces accurate signals
- The indicator is uncomplicated and easy to use
- It is versatile and may be used in any timeframe
- You can get it free on several platforms
- It provides fast technical analysis for intraday traders
Cons
- The indicator is lagging, which will provide you with signals after the trend has already begun
- It uses two parameters that are not enough under every condition to predict market movement
Best Forex Trading Course

The best Forex trading course is the One Core Program from Asia Forex Mentor by Ezekiel Chew. While trading skills are lucrative, it may take you so long to grasp what works and what doesn't. It builds your skills from the viewpoint of a new trader with fear into an advanced trader working with strategies.
Your best option is a great course. Trainers and mentors are aware of what will help you conquer the markets. Fumbling alone can waste your chance at a lifetime career in trading. A course helps you fast-track on a tried and tested model.
Many traders make a final stop at the One Core Program. Which is among the top ten credible courses you can bank on? Traders go on to hit six-figure trades following a proven model. It's a course that has helped retail and institutional traders transform their trading careers.


Best Forex Brokers
Conclusion: Supertrend Indicator
The Supertrend indicator is a powerful tool that can be used to trade in any time frame. It is most commonly used on intraday charts and is a versatile indicator that can be used to find entry and exit points in a trend. In addition, the Supertrend indicator is easy to use and provides fast technical analysis.
If the Supertrend indicator is used effectively, it can be useful for generating decent profits. However, while the Supertrend indicator has its pros, it also has some cons. One of the main disadvantages of using this indicator is that it is lagging, which means it will provide you with signals after the trend has already begun.
Despite its disadvantages, the Supertrend indicator can still be helpful, particularly for day traders looking for quick technical analysis. To make the most of this indicator, familiarize yourself with its parameters and use it in conjunction with other technical indicators.
Supertrend Indicator FAQs
Which Supertrend Indicator is best?
You need to combine the most indicators for the best results. For example, you can combine Supertrend with MACD, RSI, and Parabolic SAR to get the most accurate signals.
Is Supertrend a lagging indicator?
Yes, it is a lagging indicator as it depends on the current price to generate signals.

