Want to jump straight to the answer? The best forex broker for traders is Avatrade
The #1 Forex Trading Course is Asia Forex Mentor
The spinning top candlestick pattern is a popular technical analysis tool that modern traders use to identify potential market reversals. The candlestick gets its name from its unique shape, which looks like a spinning top. This technique is from the ancient Japanese rice trades still ruling the modern trading world and its humble candlestick. Technical analysts love it because of its simplicity in understanding and use.
Candlestick pattern offers better trading opportunities as it helps with reward ratio and risk management. In addition, they provide both exit and entry restrictions, allowing the trader to plan ahead of time. Finally, this candlestick pattern's feature aids traders in adhering to the trading discipline. Candlestick patterns like the daily, weekly, and monthly charts may be observed on all intraday and long-term ones.
Whether a newbie or an advanced trader, you can easily identify the pattern and technical analysis. Swing traders and others can use the pattern since it forms in all chart time frames. Scalpers and short-term traders may utilize it since it develops in all chart periods. Several software is available to check the patterns and alert the trader automatically. The key to using this candlestick pattern is to be patient and disciplined.
To understand the spinning top candlestick, we have got Ezekiel Chew, a well-reputed trader, to share his take on the candlestick pattern with us. Ezekiel Chew is the founder and head of Asia's largest forex education company. Let's share his point of view on spinning top candlestick, how it is formed, bullish vs. bearish pattern, and more.
What is Spinning Top Candlestick
A spinning top candlestick pattern is a type of candlestick that has a small real body with upper and lower shadows that are almost equal in length. The candlestick's small real body means that the days open and close were very close to each other.
Here is an image of a spinning top candlestick:
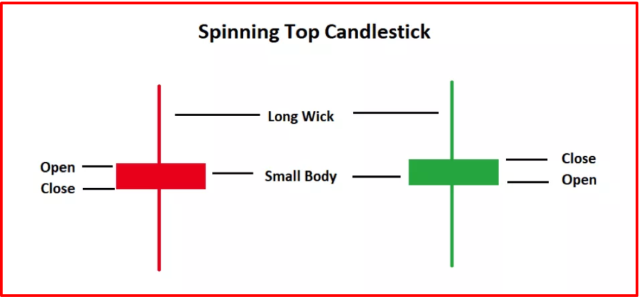
Remember that a candle can be a bull or bear; the key is that the open and close prices are close. The upper and lower shadows show that the bulls and bears were fighting, but neither side could gain control of the market price.
The length of the shadows can vary, and the real body can be either black or white. The small real body indicates that the market is indecisive and has no clear direction. However, subsequent candles help forex traders assess and confirm price continuation or reversal.
How is Spinning Top Candlestick Formed
The spinning top candle indicates uncertainty in the market. The small real body with a tiny gap between the opening and closing prices suggests that neither the bulls nor bear were able to gain price control. Meanwhile, long wick indicates a battle between buyers and sellers, and the results will be the same.
Buyers can push the prices higher, but sellers can bring them lower. These reduced prices didn't last long since the buyers regrouped and neutralized the sellers, leaving no clear winner. As mentioned earlier, the candle is formed due to the market's indecision, one of the technical indicators indicating the equal strength of buyers and sellers. However, most technical analysts count it as a weakness of the current trend. Therefore, they expect a price reversal and look for confirmation of the price reversal to develop a trading strategy.
Bullish vs. Bearish Candlestick Pattern
Technical analysts are responsible for identifying the trading instrument path. They look for the bear or bull trend direction and devise the best trading strategy. Not only that, but candlestick experts also provide the patterns to answer whether the market is bearish or bullish.
The spinning top candle is a bearish reversal candlestick pattern found at the top of an uptrend. If found at the top of an uptrend, it might indicate that the market is losing steam, and a price reversal to the downside might occur. On the other hand, a spinning top found at the bottom of a downtrend might indicate that the market is oversold, and a price reversal to the upside might occur.
Reversal vs. Continuation Candlestick
Forex traders seek candlestick patterns that can help them predict whether or not the current market trend will continue or reverse. This vital analysis helps them understand the market trend and look for the reversal of this trend.
Candlesticks may also indicate the present trend strength level, allowing traders to make trading decisions based on that information. For example, the spinning top pattern is neither a reversal nor continuation pattern, yet the subsequent candles confirm price movements.
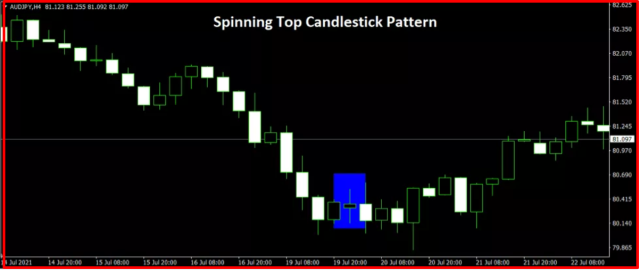
How to Trade Spinning Top
The above graph displays a spinning top candlestick trading strategy. The price is up, as evidenced by long white Bull candles. After the trend, a spinning top candle with a tiny white real body and long wicks appears. The Bears have emerged as the market's new power, revealing the Bulls' vulnerability. Nevertheless, the Bears have gained enough strength to halt the Bull run for now. This position of uncertainty is a powerful argument for price reversal in technical analysis.
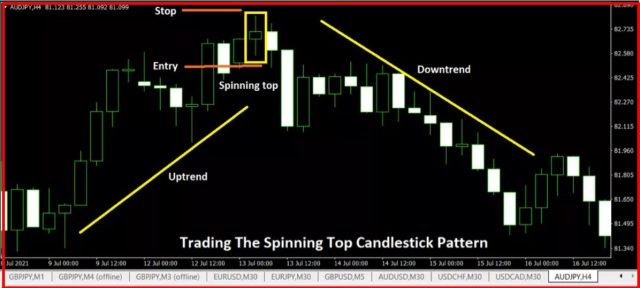
The following candles confirm the potential price reversal and depict a Bear candle. As soon as the price passes the low spinning top, a sell trade can be placed with a stop loss at the high of the spinning top candle. The take-profit objective should be twice as long as the Spinning Top candle. However, it is preferable to ride on the trend rather than attempting to time it accurately. Technical traders can keep their bets and monitor for any reversal pattern or market weakening, then exit accordingly.
Likewise, if the price forms a spinning top candle during a downtrend, it shows the trend reversal. So, as a trader, you can anticipate a price reversal. In this case, if the price goes higher than the high of the spinning top candle in subsequent candles, it is a signal to buy. Forex traders can place a BUY trade with a stop loss below the low of the pattern candle. A potential profit point is twice as big as that of the pattern candle. Instead, riding the trend and positioning yourself for an exit when the trend weakens, or reversal signals appear is usually a good idea.
Doji vs. Spinning Top
The Doji is a special case of the spinning top. A Doji is a candle with an open and close that are virtually equal. The Doji candlestick is one of the most important reversal signals in candlestick charting. The below image shows the Doji and a spinning top pattern.
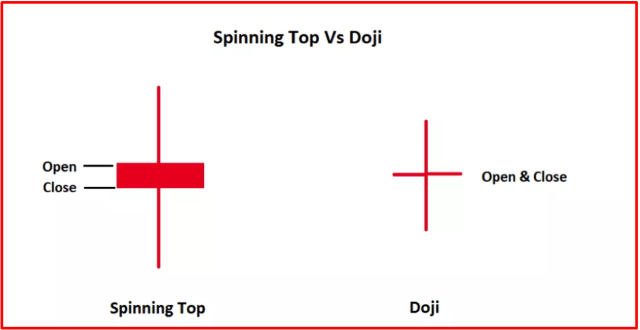
The top is a candlestick with an irregular body and long wicks, while the bottom is one with a short body and short wicks. Doji's actual length is nearly nonexistent because the opening and closing prices are almost identical. The real breadth of the Spinning top is wider than that of the Doji.
Doji and Spinning tops are both indicators of price reversals, and they may only be created during stable or low-volatile market situations. Gravestone Doji is one type of Doji that can indicate a trend ahead. The Long Legged Doji is another form of Doji that may signal a trend in the making.
Best Forex Trading Course

Asia Forex Mentor is one of the most credible forex trading courses available today. It is headed by Ezekiel Chew, a trader making six figures per trade for over a decade. The trading methods are backed by mathematical probability and the trainer behind banks and trading institutions.
AFM PROPRIETARY ONE CORE PROGRAM is the core program that covers from beginner to advanced, and every segment must include the above points. The program is designed to make you confident and earn as quickly as possible in live markets.
It starts with the basics of forex trading and moves on to more advanced topics such as risk management, market analysis, and trade execution. The course also includes a live trading session where you can see the techniques being applied in real-time. If you're serious about learning forex trading, sign up now!
Best Forex Brokers
Conclusion: Spinning Top Candlestick
A Spinning Top candlestick is a technical analysis tool that signals the market is undecided about the direction it wants to move. The candlestick is created when the market trades higher than the opening price and lower than the closing price. The wicks on either side show that the market has been volatile, but it ultimately closes near where it opened.
The Spinning Top candlestick pattern is a common candlestick pattern that may be recognized quickly due to its shape. The pattern indicates hesitation in the market trend, although it is seen as a price reversal pattern. Since indecision implies that the price may continue or reverse the trend, the next candle after the pattern candle is important for determining a possible trade entry.
When trading the Spinning Top, pay attention to the size of the candlestick and the location where it is formed. Moreover, to be a successful trader, you should always combine candlestick patterns with other technical analysis tools, such as support and resistance levels, Fibonacci retracements, or moving averages.
Spinning Top Candlestick FAQs
What does the spinning top candlestick indicate?
The spinning top candlestick pattern is a reversal signal that indicates indecision about the future asset direction. It depicts that the buyer or seller can't gain the upper hand.
Is spinning top bullish or bearish?
The spinning top candlestick is a bearish signal in an uptrend and a bullish signal in a downtrend.


