

Want to jump straight to the answer? The best forex broker for traders is Avatrade
The #1 Forex Trading Course is Asia Forex Mentor
Forex traders have very many strategies to help them conquer the financial markets. But, one point that leads to success is the in-depth understanding of the correct way to analyze a market, plus the strategy to join in with low risks and exit profitably.
Our focus here is on the Shark Pattern. And in order to get you the best ideas about it, we take the approach of requesting experts to share their experiences with it.
Therefore, to share an expert opinion on the Shark pattern, we’ve invited the indulgence of Ezekiel Chew.
Ezekiel is an expert from Asia Forex Mentor, where he is the Co-founder and lead trainer. In other circles, you’ll find him sitting in globally acknowledged panels discussing insights and analyses of the markets.
As part of the synopsis, this post shares how to identify the Shark Pattern in the context of whether it’s bearish or bullish. Also, there’s a key section guiding traders on how to trade the setups the pattern presents.
Towards the end, there's a clear way to work with the shark pattern across trading software. Plus, of course, a key section for the FAQs those traders may require clarification on.
What is a Shark Pattern?
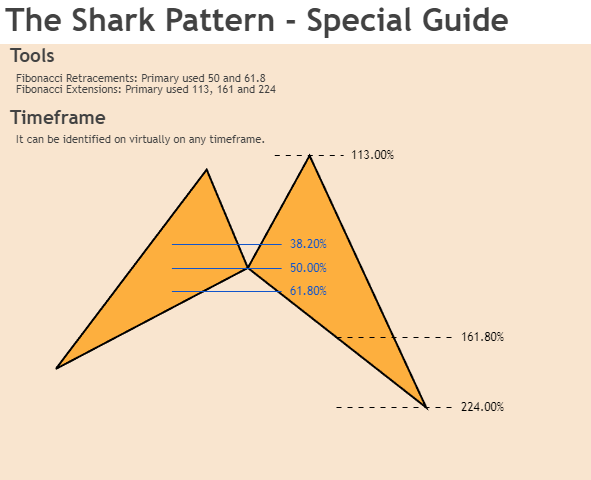
A shark pattern forms with five legs with specific Fibonacci ratios. Specifically, a shark pattern is a reversal pattern from among the broader family of harmonic patterns. Records indicate that Scott Carney first documents the formation back in the year 2011.
On a specific note, a shark pattern is supported by key Fibonacci ratios. However, its validation further gets the support of the Elliot waves theory. In other circles, traders may prefer using the name – a Shark Harmonic pattern.
Among other harmonic patterns, the shark pattern falls among the most complex pattern. And one key reason it comes out as complex arises from the way traders approach it in trading.
So, its trading has some uniqueness you will not find common among other harmonic patterns – like the Crab, Bat pattern, and the Gartley.
For purposes of setting records very clear, trading the Shark harmonic pattern does not require traders to wait until its formation completely.
With other harmonic patterns, the last leg of formation is usually the CD. However, specifically, the Shark harmonic pattern completes with the swing leg BC.
A Shark pattern typically works with five points marked as O, X, A, B, and C. This is not the case with other common harmonic patterns which use the default labels with the marks X, A, B, C, and D.
Other than the above point on the default notation of the points, here are two keynotes on the identity of a shark harmonic pattern:
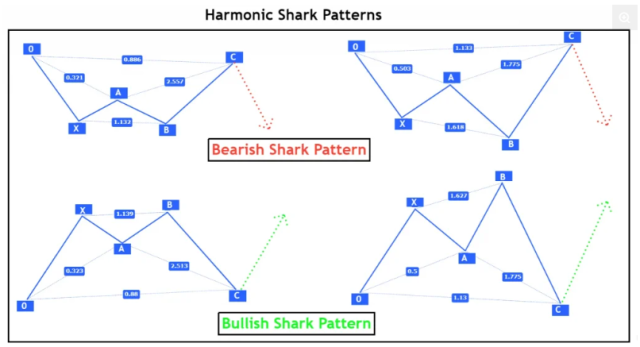
First, on bullish trends, the shark pattern forms two double tops. And they appear at point B.
Secondly, in bearish markets, the opposite takes place – double bottoms.
And in either case above, the double tops or bottoms play a significant role in helping the traders and analysts identify the shark harmonic pattern.
Bullish Shark Pattern
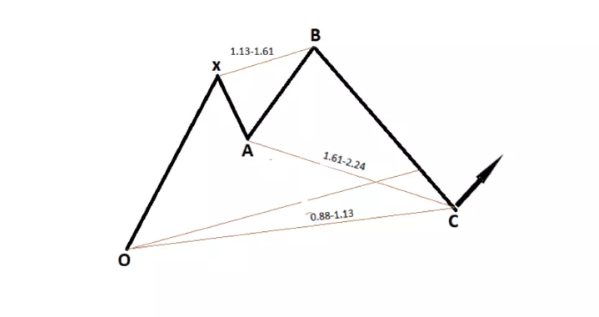
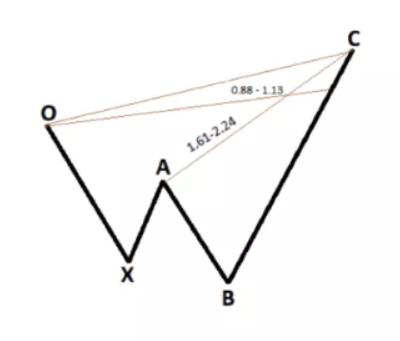
We’ll use the illustration below to expound more on the Bullish Shark patterns. And primarily, the bullish shark pattern forms within markets that are bullish – or in other words, trending upwards.
As earlier hinted, the pattern has five points which are named O, X, A, B, and C. Also, these five points mark four major swings or legs.
Next are explanations in detail, expounding on fine details pertaining to each of the major swings/legs with a bullish shark pattern.
#1. Swing from point O to X or the Leg OX. You may also refer to this as the impulse leg or initial leg. At this point or phase, the prices maintain a bullish momentum – and analysts say that prices here are being driven by an impulse.
#2. Swing from point X to A or Leg XA. Analysts refer to this as the retracement of a bullish shark pattern. The retracement occurs once prices hit the resistance zone at the peak of the bullish impulse. And notably, for a shark harmonic pattern, the Leg XA makes a retracement to a maximum of 1.13 of the leg OX.
#3. Swing from point A to B or Leg AB- being the third swing or leg of the harmonic shark pattern is usually the third leg of the shark pattern. With this swing, the prices turn bullish again or keep rising. However, on a more specific yet peculiar note, the prices make a higher high – a peak that forms higher than the one hit by the impulse OX. And the prices for the impulse will score a range from as low as 1.13 to as high as 1.61 Fibonacci ratios.
#4. Swing from point B to C – And the leg BC swing leg is usually swing number 4. It forms the retracement number 2 for the bullish shark pattern. Typically, this retracement takes the form of an impulsive fall. So, to be within the ordinary formation of a bullish shark pattern, the fall takes a range from as low as1.61 to as high as 2.24 of the leg or swing AB.
The Point C shark harmonic trading strategy
Point C marks the final leg of the harmonic shark pattern – CD leg. Analysts refer to it as the terminal point. The focus around terminal point C brings in the context where traders should search for market entry signals.
In terms of Fibonacci levels, terminal point C comes within the ranges of as low as 0.88 to as high as 1.13 of the leg OX.
When prices hit the conditions above, prices take on a bullish break. And it’s the main reason the naming picks on the bullish harmonic shark pattern.
Set up of Bullish Shark Pattern
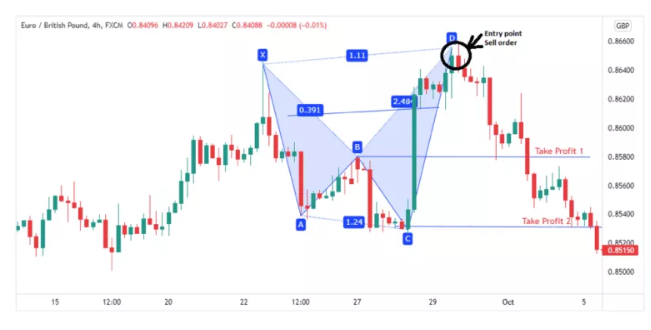
To help us grasp the best ways to approach trading setups for the shark pattern, we’ll rely on an image of the chart.
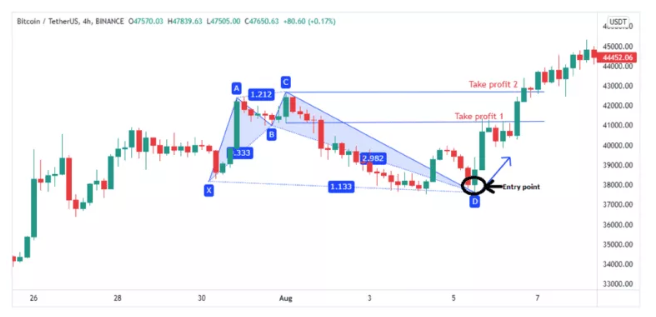
As you are aware, the default naming of the points within a Shark pattern is OXABC. However, to simplify matters here, we’ll deviate from that and use the commonly known labels for most of the harmonic patterns. So, we’ll adhere to labels as XABCD.
Therefore, the setup below is for exemplification purposes only. So, traders and market analysts should feel free to interchange the D for the C. But most important is to spot the right formations to inform the entry.
In reference to the image above, the bullish shark pattern forms with the key points conforming to the points highlighted by the labels XABCD.
Notably is the retracing of swing BA as a ratio of the initial swing – coinciding with Swing XA. The other key point is the position of point D scores a lower price than point X.
In our case above, point D takes the place of terminal point C in ordinary labeling of the Shark harmonic patterns.
As part of the analytical confirmations, to verify that this is a clear shark pattern formation, we look at the Fibonacci extension of the leg BC. In this case, the extension makes it to 1.14 – which is well within the Fibo range of between 1.13. To 1.61. Therefore, it’s a clear shark pattern formation.
Of course, the above confirmation does not work singly. So, other ways to help confirm the formation of a shark pattern are:
- One is the impulsive fall from point C all the way to point D. It’s a clear retracement of the prices from the initial impulse – that is, the swing X to the higher high at point C
- Next is point D in terms of the price or a swing-low position. Typically, for the shark pattern, the point D sits lower than the point X
Once the above setup is clear, the target for traders is to join the markets once prices are on course with the targets of the final leg – that is, from point C to D. If you look keenly at our image above, the entry region is made with a black arrow.
In that order, traders join the market, targeting a bullish break from point D. And here, the Fibonacci retracement tool comes in handy. Use it to place the stop loss position at level 1.27 of the straight line linking points X and D – practically, this should be a zone point D.
Practically, from our chart above, the SL best fall at around the price 3700.00 level.
As regards the best take profit zones for the Shark pattern, there are two key points.
- First, it’s at the level when prices break towards the region of point B. This should be an ideal take-profit position 1
- Second, taking profit position to come into focus should apply if prices still oscillate further upwards to the former higher-high at point C
However, if bullish momentum allows, traders should keep adjusting the take-profit positions further above point C to as far high as the price lines allow.
How to Trade the Bullish Shark Pattern
At this point, we have to set the records very clear. There is no must-follow strategy or method to take trades with a bullish shark pattern.
With that set clear, good trading builds of the model with anticipation that prices will break up into a bullish momentum. Of course, there are probable turning points, yet, with no certainty that everything will retain the set course.
So traders are free to fit into anything that works with the insights built on the inference – with protective measures in place.
And to add to the above insights, we’ll add more generic ones below to enrich your analysis.
To begin with, most traders will prefer joining the markets once point C is hit – the terminal point.
- You can set a stop loss either above or below the swing leg AB – that is, a Fibonacci level of 2.24. Plus, take your profits at the level of 50% of the swing leg BC
- The other way you may join in with a shark pattern is by placing a buy-limit order. This most with levels of not less than 0.88 and not more than 1.13 depending on the swing leg OX. Of course, you set a stop loss position at the level 1.27 extension depending on the height of the swing OX
So, once the pattern breaks into a bullish sequence, traders can ride on the above two methods of entry. Each has a clear setup to take profit – that is, at zone A or zone B. And the best way is to keep raising the protective stops – it will secure profits at any point if the markets retrace to terminal point C.
Bearish Shark Pattern
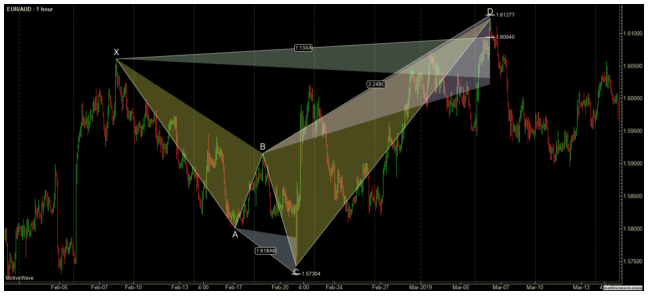
A bearish shark harmonic pattern anticipates that prices will break up into a bearish sequence after its formation.
We’ll use the figure above to help us grasp better the pattern – more so regarding the key Fibonacci levels, it navigates.
#1. Swing or Leg OX forms the first leg, a bearish move where prices make an impulsive fall.
#2. Swing or Leg XA – This forms a retracement of the first impulsive fall in prices. So prices turn bullish and reverse the bearish gains made from the swing OX.
#3. Swing or Leg AB – which is the third move/leg in the bearish shark pattern formation. The movement here sees prices fall and consolidate at the point marked B. And more notably, the dip in price navigates to points lower than the extent of impulse 1 (Or lower than point X)
#4. Swing or Leg BC –This marks the final movement within the bearish shark pattern formation.
And more specifically, the terminal point C comes within the Fibonacci levels, with ranges of as low as 1.61 to as high as 2.24 with respect to the swing leg XA. That falls within retracement regions from 0.88 to 1.13 with respect to the swing leg OX.
Set up of Bearish Shark Pattern
We’ll use the figure below to guide our discourse on trading the bearish shark harmonic pattern.
Using the entry point shown with a black arrow, traders can open positions with anticipation of the bearish move.
Ideally, taking profit level 1 coincides with price zone B, while taking profit position 2 is around the terminal point C zone.
However, traders can allow for further price breakdowns with a set stop loss to protect profits as far low as possible.
How to Trade the Bearish Shark Pattern
The rules for the bullish pattern apply, but with prospects of price dips or bearish market swing wave movements. So as a highlight, we’ll share one approach:
Setting a buy limit order. Should not be lower than 0.88 nor higher than 1.13 of swing leg OX. Also, set stop loss at 1.27 of swing or leg OX. Plus, take profits within zone B or lower at C, or as far down as possible with protective stops.
Best Forex Trading Course

Ezekiel Chew is a renowned forex trader, trainer, and industry expert. He has trained professional and retail forex traders as well as corporate finance players like bank traders, money managers, and asset investors. From his trading experience drawn from over 20 years of trading the forex markets, he has created a comprehensive forex trading course known as “the one core program”.
Ezekiel asserts that the one core program is designed for the ‘committed learner', so previous trading knowledge or experience is not required before you can enroll in the program. The program comprises over 60 video lessons that teach proprietary trading strategies that are backed by mathematical probability and technical analysis principles.
The one core program has been proven to be highly efficient as it has generated millions of US dollars for Ezekiel Chew and his students. There are numerous testimonials from students that have graduated from the program and are now making six-digit figures per trade just by applying the techniques learned from the program. The one core program is available on the Asia Forex Mentor website; which is a forex trading blog that has been existing for over a decade.


Best Forex Broker
Conclusion: Shark Pattern

The Shark harmonic pattern presents traders with two setups to trade – bearish or bullish breaks.
Analysts and traders may access the harmonic indicator as part of trading software – for free. Or pay a small fee to upload it as an additional price structure scanner to point out a potential reversal zone.
Once the setups are ready with harmonic trading, traders have to observe the risk mitigation measures and correct money management.
Other than the setups in this post, traders are free to fit the insights from the pattern to other shark harmonic trading strategies as they prefer. Also, traders can explore other close opportunities like the harmonic crab pattern strategy.
Lastly, a shark harmonic pattern is usually a five-leg reversal pattern. And it’s the reason why trade entry anticipates reversals once price hits the terminal C point – with respect to whether the previous trend was bullish or bearish.
Shark Harmonic Trading Pattern FAQs
Is Shark Pattern Reliable?
The reliability of a harmonic shark pattern depends on correct use. First is clear identification and correct timing of entry with good risk-to-reward ratios.
What type of Pattern is the Shark Harmonic Pattern?
A shark harmonic pattern is a trend reversal strategy. Therefore, it works very well after prices trend in one direction, as a trader targets an ultimate reversal.


