
Want to jump straight to the answer? The best forex broker for traders is Avatrade
The #1 Forex Trading Course is Asia Forex Mentor
Parabolic SAR – Quick Video Setup tutorial
A Parabolic SAR is a technical indicator that helps determine trend direction and gives hints when the trend direction faces an acceleration factor towards reversals. Some traders may refer to it as the “stop and reversal system.” The developer of the Parabolic SAR is J. Welles Wilder Jr., who also came up with the Relative Strength Index or the RSI.
While the parabolic SAR settings are very easy to use, traders must be keen to use the correct settings, which also play a part in the profitability. With default settings, parabolic SAR settings classify it as a lagging and trend-following indicator. Meaning it scores late responses to price changes. However, it captures turning points very well for many trading techniques – be they pullbacks or trend reversals.
For the purpose of this post, we'll seek guidance from Ezekiel Chew, a long-time trader and lead trainer with the Asia Forex mentor brand. He will share with us the fine details on the applicable scenarios and also share proof via backtest documentation on the PSAR indicator.
Parabolic SAR may create some form of confusion, where traders do not accurately distinguish the start of reversal arcs. And in line with the weaknesses pointed out with the PSAR, Ezekiel will guide us on what tools can best help fix the weaknesses with the Parabolic SAR indicator.
Through the post, traders will find out a section with the advantages and the disadvantages of the Parabolic SAR after a careful pointing out of the trading rules applicable. Towards the final wrap-up of the post, we’ll share in detail the analysis of backtesting results.
What is Parabolic SAR
A Parabolic SAR or PSAR appears as a series of connecting dots on a chart. The dots appear either slightly above or below the actual price of an asset with respect to the swinging direction of prices. Conventionally with the PSAR indicator, dots below a Priceline denote uptrends. Conversely, dots above the price denote a downtrend. Parabolic SAR is also the SAR that arises with the notion of the acronym from the stop and reverse system. Traders can use it to refine their points of trade entry as well as exits.
The creator of the indicator Parabolic SAR primarily recommends that it be applied to discover the directions of trends. Therefore, other indicators or tools can help traders grasp other aspects like the strength of the trends towards helping with trading insights.
When graphically plotted on a chart, the Parabolic SAR indicator is displayed as a series of dots. If it appears below the current price, the parabolic SAR is interpreted as a bullish signal. When it is positioned above the current price bars, it is deemed to be a bearish signal. The signals are used to set stop losses and profit targets.
One compatible indicator with SAR is the average directional index momentum indicator. It can help confirm trend strength. Also, SAR can work well with others like both Candlestick patterns and moving averages.
In practical application, if a price line falls into the lower region of a long-term moving average, parabolic SAR can help re-confirm the sell signal. And the converse applies – if price lines shoot above the long-term moving average, a Parabolic SAR can help re-confirm the same as a buy signal.
How to use Parabolic SAR Calculation
PSAR, or the Parabolic SAR, is a straightforward indicator to understand and use in trading. First, if PSAR predicts bullish trends, it will indicate a dot slightly below the candle formation. And the reverse applies – when PSAR predicts bearish prices (price falls), a dot displays on the top side of a candlestick formation.
PSAR relies on the momentums to predict the moves as either bearish or bullish. Basically, PSAR weight momentums for both bears and bulls. For instance, if bullish momentum outweighs that of bears, the overall momentum prediction goes to bullish prediction.
It's important to point out here that PSAR, like most indicators, tends to give conflicting signals when markets consolidate. However, it's also a very clear fact that the longer the distance between a Candle and the lower or upper dot, the stronger the momentum. And in that order, the narrower the distance between the dots and candles, the lesser the strength of the current trend and momentum.
Traders can work with the prediction by trailing the potential reversals of trends. The other way to work with PSAR is to place stop-loss positions while trading a current trend. The only foul would be the Stop Loss position tends to be at an extreme point.
Parabolic SAR Indicator Trade Rules
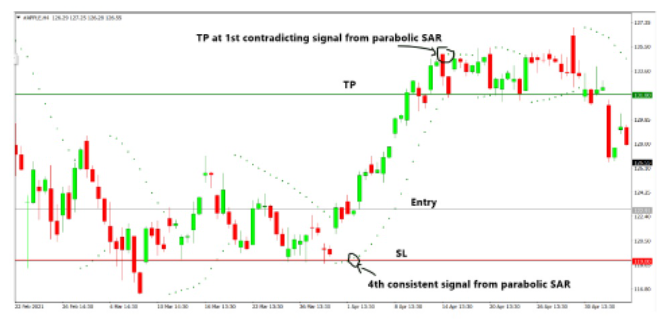
PSAR best helps traders who target trend trading specifically with entry and exit points. And it’s best to apply the indicator where the consistency of prediction remains. Therefore to minimize the instances of false signals, we enter trades after three consecutive dots or price bars. In better words, wait for three candles to close and join in with the fourth candle.
For buy trades, traders should target the highest position or closing of a fourth candle to join in the trend via a pending market order. To place a stop-loss position, work with a point clearly below the last dot shown by the PSAR indicator. Lastly is the best position to take profits. Take profit position with PSAR should be whenever the indicator displays the earliest acceleration factor towards trend reversal signal. In our case, it is a dot that closes above a candle.
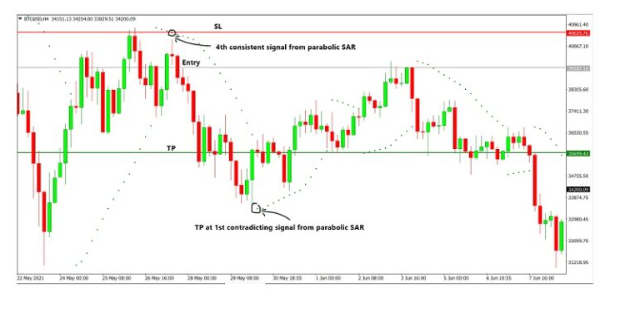
Also, for short or sell positions, points of entry are pending orders placed below the lowest close of a fourth candlestick. And all take profit positions set at the first point when the indicator shows a trend reversal. In this case, it should be a dot below a candle indicating market trends attempting to shift from bearish to bullish.
Pros and Cons
One key benefit of PSAR as a technical indicator arises from its capability as a good indicator to help predict price action and its probable direction. Especially in trending markets, the Parabolic SAR is known to score very good results. The other beneficial aspect of the PSAR is showing exit signals whenever a trend is building the momentum to reverse. Therefore, just to put on more strong emphasis, PSAR is very helpful in huge trend moves – bullish or bearish.
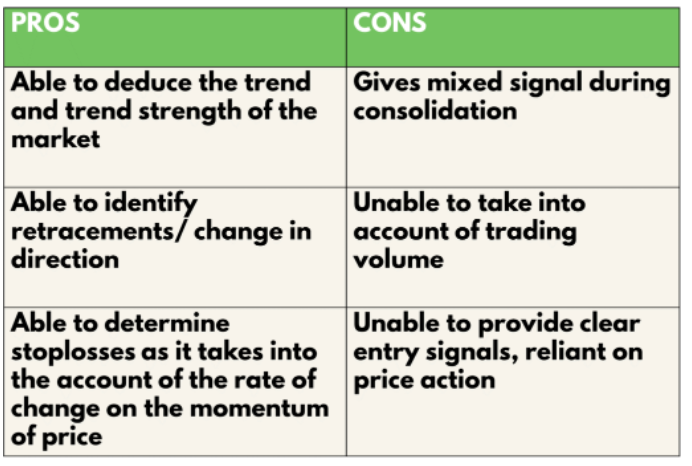
One prominent downside with PSAR is the drawdown with giving mixed signals in choppy or consolidating markets. As price bars are confined to sideways market conditions or rectangular channels, the indicator will definitely generate mixed SAR trading signals. And therefore, it may not be the best indicator for helping traders profit within choppy markets. If anything, they may end up making very many losing trades.
Parabolic SAR fails at tracking the build-up of market trading volumes. And insights with market volumes form a key complement to trading. Also, the placement of SL positions seems so punitive to traders, and it's best to approach it with lower position sizing and reasonable risk-reward ratios.
The best way to trade with a PSAR or stop and reverse indicator is to first locate trending markets and entirely avoid consolidating markets. And, of course, it's encouraged to spice up the market inferences by combining other indicators like the Moving Averages. Moving into trades with extra indicators only helps to better results with richer insights before making commitments.
Parabolic SAR Analysis
Towards examining the profitability of the trading strategy with the indicator -Parabolic SAR, we'll carry out backtests. Each run will comprise the 10 trades taken from the 9 June 21, and we'll for this run work with the four-hour (H4) timeframes.
Our rules of entry adhere to the rules we've gone through above. And in pursuit of variety, we'll backtest across three market varieties: EURUSD representing Forex Currency pairs, AAPL representing the stock markets, while the BTCUSD stands in for crypto or digital assets. Also, to make matters simple, we’ll take trades with the assumption of a 1% risk for the capital in trading accounts.
Key Formula Definitions:
- Average Risk to Reward Ratio= ( The Total Risk to Reward Ratio of all Wins / The Total Number of Wins)
- The Profitability Gain (or Percentage (%) Gains)= (Number of the Wins X The Rewards)- (Number of Losses X 1) [ Risk is which is @ 1%]
Here Below is a pictorial representation of the results after applying the PSAR trading strategy:
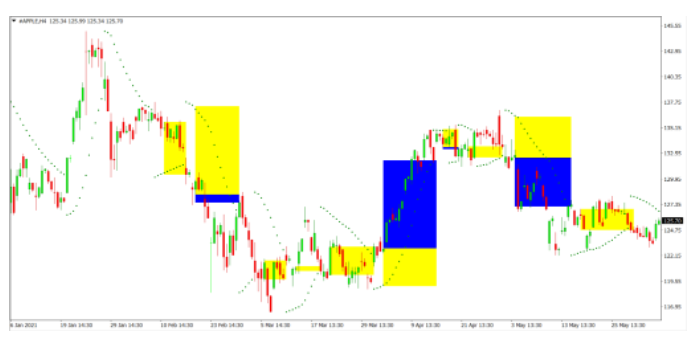
As part of the inferences from the graphic image above, we make each trade with a combination of Blue and Yellow colors. For each trade, the blue zones show our rewards won per trade. The Yellow zones stand in to represent the risks taken per trade.
Summary of Backtest Results for Parabolic SAR
Win Rate for PSAR
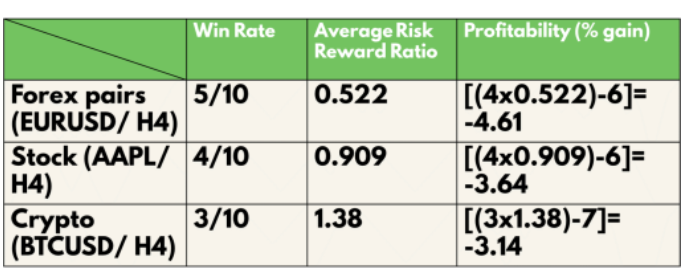
- Forex markets EURUSD scores a 50%
- Stocks markets via AAPL scores a win rate of s 40%
- Cryptocurrency markets via BTCUSD scores a 30%
Parabolic SAR scores for the average risk-reward ratios across the three markets:
- Forex, represented by EURUSD, scores a 0.522
- AAPL representing the Stocks, scores a 0.909
- BTC representing Cryptocurrencies scores 1.38
The third and last cohort of results for PSAR pertains to the profitability of trading the strategy:
- First, from Forex, EURUSD has a profitability of -4.61
- From the stocks, the AAPL scores a profitability of -3.64
- From Cryptocurrencies, the profitability score is at -3.14
Best Forex Trading Course

One Core Program is a course in which the lead Trainer – Ezekiel Chew aims to pull you into an inner circle to share over two decades of efforts that culminate into an expertly crafted path to better trading. There are many free materials you can read and get insightful trading content via the Asia Forex Mentor. However, the One Core Program comes to fast-track your progress.
One Core Program is the course that has helped both retail and institutional traders to level up their game at everything they need to know and turn the tables of their trading careers for the better. One Core Program is a balance of many aspects that traders miss in the markets.
Among the outstanding benefits of the One Core Program is the ability to transform all traders – retail or institutional into a mindset of winning traders. Ezekiel dabbed it as Lifestyle trading. And you must not quit your job or hobbies to get to learn and trade onwards successfully. Lifestyle trading only requires as little as 20 minutes daily for you to onboard with the winning habits.
Lastly, one key aspect you'll come to appreciate is the proven path to success. Ezekiel lays emphasis on the fact that winning in trading is not a cumulative effect of trading in fear and greed while staring at charts all day. Enroll and take on the One Core Program to best grasp the sure bullet to your lifetime of successful and fulfilling trading careers.


Best Forex Brokers
Conclusion: Parabolic SAR
As you can see, the Parabolic SAR is a good indicator of trending markets. The best way to go about it is to establish a trending direction of a market and confirm it via the PSAR indicator. Using the PSAR with other complementing technical trading systems or indicators helps increase odds by eliminating monitoring price movement, false breaks, and wrong trades in financial markets.
While the gap for the stop loss position seems too big for a PSAR indicator, traders should not ignore it as one among the arsenal in their tools of the trading portfolio. Sure the risk to reward ratio is poor. However, it’s very easy for a trader to grasp and use the indicator in their trading.
During trending, traders get early trade signals on an impending reversal, and therefore it sounds the earliest warning to exit. Already, we've exposed the keynotes that PSAR will be of very little help with consolidating markets. If anything, you'll get mixed and awfully wrong signals from PSAR.
Overall, Parabolic SAR will push you into drawdowns if you use it alone. Hence, it's best to use it as a confirmation of trend continuation. Also, it’s great to determine trend direction plus the reversals or pullbacks along the way. To get the best results, PSAR requires combinations of other technical indicators that show volumes and momentum (acceleration factor). The parabolic SAR indicator is a good fit to combine in trading with moving averages.
Parabolic SAR FAQs
Is PSAR Strategy Profitable to Trade Forex?
Regarding whether the Parabolic SAR indicator is profitable, we’ll discuss two scenarios. One PSAR is not awesomely profitable on its own at generating trade signals. The excessive SL position can amount to huge drawbacks on your capital. Being a lagging indicator, it may not pinpoint great moves quite early for you as a trader – and that's what you are hunting for primarily. PSAR will score worse performance in sideways market conditions at failing to detect market volumes.
A second and converse scenario is where PSAR is applied optimally by including another indicator like moving average confirmations when taking trades. When approached with a combination of indicators, PSAR is a wonderful tool. Trend traders are able to sniff trade signals early enough when trends build-up towards a reversal or a pullback in the markets. Summarily, and with other things held constant, traders will find the Parabolic SAR awesomely profitable.


