
Want to jump straight to the answer? The best forex broker for traders is Avatrade
The #1 Forex Trading Course is Asia Forex Mentor
Every tradesman has a duty to understand the tools of the trade they use for their respective professionals. The same is brutally true for Forex trading. And one among the arsenal of tools is the KDJ indicator.
And to help us in the discourse around the KDJ indicator is a renowned financial markets analyst – Ezekiel Chew. Ezekiel helps traders understand the markets by sharing insights from the point of a successful trader-turned-trainer. Under his belt are 20 years of expertise in trading.
As part of our focal point, this post will shed more light on how the KDJ indicator helps traders with the analysis and picking of signals. Over and above sharing the insightful tips, readers will see how best to compliment the KDJ indicator with others.
As a highlight, the post will point out the key elements that comprise the KDJ indicator. Lastly will be a key section on key questions that traders and market analysts may have regarding the indicator.
What is the KDJ Indicator?
The KDJ indicator is classified as a technical indicator. It helps traders and market analysts with two key elements in the market analysis:
- One is helping traders forecast the trends of prices into future timeframes
- And second, the KDJ indicators help with the analysis of common price patterns
For your information, there's a section of traders who prefer referring to the KDJ indicator as the Random Index.
KDJ is very helpful for confirming short-term trends of asset or Forex pair prices. So, other than trend verification, KDJ has one useful point. It helps traders to optimal entry points along stock trends.
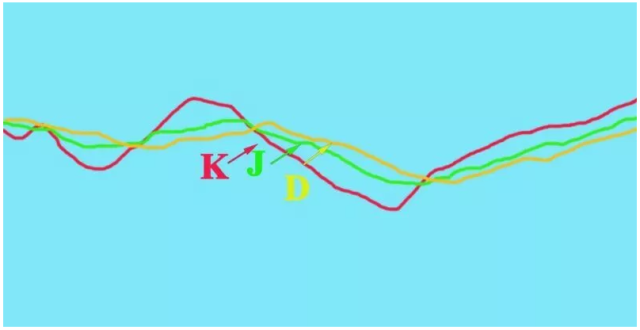
As regards technical appearance, the KDJ indicator comprises three sets of lines. And the lines are best known by the abbreviations K, D, and J. So it derives naming from the three constituent letters, respectively.
KDJ approaches the markets with two points:
- First is the highest price point
- Secondly is the lowest price point
Plus, it incorporates the magnitudes of price fluctuations
Analysts have confidence that the indicators reflect pricing levels with reasonable accuracy. Practically:
- K line is usually the fastest index – yellow line
- D is the slowest index – blue line
- J is the moderate or medium index – red line
In terms of the calculations, the index value is a percentage – ranging between the digits 0 at the lowest and 100 at the highest. In extreme scenarios, the figure can fluctuate lower than 0 and above figure 100. And in summary, for purposes of comparability, the software is limited to the range of 0 to 100 for ease of market analysis.
Meaning and Role of the J Line (Between K and D lines)
The J line with the KDJ indicator is by default green in color. And mostly sits within the band created by the lines K and D. Also, the lines K and D conform to those of a Stochastic Oscillator.
In any instance, the J line represents the levels of disparity of the values of line D from those of line K. Whenever the three lines converge; it's an opportunity for traders to make trading decisions.
Ideally, the KDJ trading clearly points out the conditions whenever the prices are either oversold or overbought zone. Of course, at both extremes, markets gear up towards probable reversal.
By default, the K D and J shows overbought at above 80%. Conversely, default settings pointing to oversold sit at and below the 20% mark.
Analysts can tweak the KDJ indicator to settings other than the defaults – 20% and 80% to make it more suitable for analysis and trading at individual levels. The tweaks should help with phasing out instances of false signals.
What is a Stochastic Oscillator?
A stochastic indicator or oscillator combines two key variables. One is the price of an asset. And the second is the momentum of the prices for a specific timeframe.
Therefore, most indicators – KDJ inclusive allow traders to adjust the variables regarding the timeframes or periods to include in analyzing the markets.
By incorporating the difference between highest, lowest, and closing price figures, the indicator is able to rate the markets. Either, the underlying asset or Forex pair can be overbought, oversold, or anywhere there between two horizontal lines.
So, market analysts are able to pick signals depending on the rates shown at a particular moment within any timeframe of preference.
As an oscillator, the score range runs from 0 to 100. But more specifically, experts rate oscillation figures above 80 points to overbought conditions. And the reverse also applies – readings below the 20 point to oversold conditions.
According to the readings, markets are expected to stay oversold as buyers step in. Next, bullish momentums build up. Also, for overbought markets, sellers step into building up bearish pressure.
While the above holds true, markets can prove analysts wrong. Hence the need for caution with proper risk measures and signal confirmations.
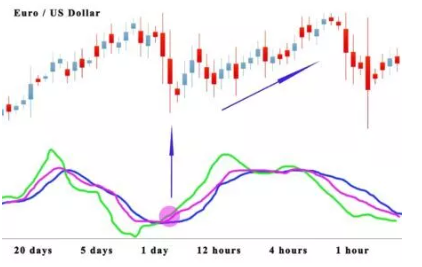
The chart showing the KDJ indicator brings out two lines. One shows the actual value – it's the value on a per session basis. The second line shows the 3-day SMA as a simple moving average.
So, while digging into the relationships between price and momentum, here is a key pointer – price and momentum go hand in hand. However, whenever the two lines cross each other, it's a signal for the reversal of the current momentum.
Many market analysts expect the stochastic oscillator to trend in the same direction as the prices. Therefore, the disparities and crossovers are picked as signals of pressure building up towards trend and momentum reversals.
Realistically, if price lines trends have been in the oversold area, scan the chart for moving average reversals:
- One price chart will make a lower low score
- Second, look at the oscillator to score a higher low
In the scenario, the largely dominant bearish trend shows signs of losing momentum. Or in other words, bulls are stepping into the markets – building up to a trend reversal and eventual bullish trend.
FX and Crypto Trading with KDJ Divergence
In most cases, the KDJ indicator is applicable for all forms of trading – Forex, sticks, and cryptocurrencies with no need for any form of adjustments.
But, it's important for traders or market analysts to make efforts to see what works best for their case. In other words, internalizing the use of the indicator in line with a specific asset or crypto/Forex pair out there in the markets.
Agreeably, a good trading strategy is more adaptive, than remaining fixed at the simple pointers of oversold or overbought conditions.
Having said the above, the scores applicable remain standard. However, it pays more if one is able to grasp where actual reactions really occur within the scores. Plus the applicable market conditions for every analyst.
To lay more emphasis, it's more rewarding to allow more flexibility in market analysis. When KDJ indicates that scores are above the 80 % percent mark – it's not an excuse enough for you to jump in with sell or going short orders.
Overbought conditions will more than often show up, yet uptrends will sustain for longer than a trader can imagine. And that is a portion of the pure aggressiveness of how markets can run.
Overall, the key thing is being able to pick a very clear signal and sift it out from fake ones. And this is where a trader requires putting in more effort by taking time to verify or check with other readers or indicators.
Towards winding up this section, the application basics remain the same. The KDJ stochastic indicator will help traders on any charts – cryptocurrencies or Forex. Either way, the same principle of application remains for those staking on call and put transactions for binary options.
Here is a great trick that we'll have to re-emphasize again- use the KDJ indicator within a strategy that firms up market analysis with another. The combination will help your technical analysis filter out false signals.
And the fewer false signals you pick for trades, the better are your chances for great prosperity at trading.
How to Prevent False Signals by Combining other Indicators
The best way to filter out false signals from the KDJ indicator is simple – combine it with another indicator. Most important here is bringing in other indicators that load more insights – other than price and momentum.
Practically, KDJ does not show volumes. And it makes great sense at factoring that into the analysis.
Here are two key indicators that blend in very well with the KDJ indicator:
- One is the Average Directional Index or the ADX
- Second is the Average True Range or the ATR
As you'll see, there's more benefit to analysis when a trader is able to first master several indicators in terms of their analytical requirements. Secondly, is bringing them all together confidently while at the real job- market analysis.
So as KDJ shows trends and momentum, the ADX is able to reconfirm the chances of trends making reversals. In the same line of analysis, the ATR enriches your analysis with the levels of volatility in the markets.
If every point from this post escapes your mind, grasp just one – there's no indicator that is so great at generating information so precise for analysts/traders. So, be open to looking for combinations that will work for your case.
For instance, adding in the Bollinger bands adds more insights regarding probable market resistance and support zones.
Therefore, to avoid losing money rapidly, make efforts to implement a raft of measures that require great diligence. Lastly, go overboard at it. Other than indicators trade carefully by:
- Trade with optimized portfolios
- Practice high standards of risk management
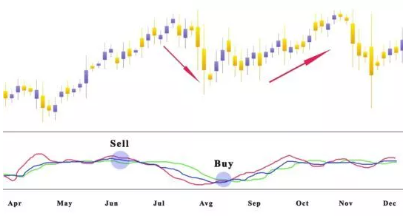
Very Practical Technical Indicator – for a Sell signal or Buy Signal
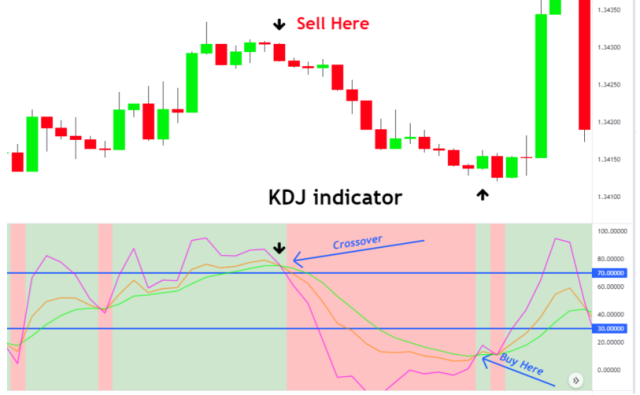
A practical approach with KDJ is observing the formations of crosses by the three lines.
- First is the golden crosses which indicate buying opportunities
- Second is the death crosses which point to selling opportunities
However, consolidations also take place – and being on the lookout where scores are – either below or above the mid-point (50 % mark)
Best Forex Trading Course

Asia Forex Mentor is one of the most credible forex trading courses available today. It is headed by Ezekiel Chew, a trader making six figures per trade for over a decade. The trading methods are backed by mathematical probability and the trainer behind banks and trading institutions.
AFM PROPRIETARY ONE CORE PROGRAM is the core program that covers from beginner to advanced, and every segment must include the above points. The program is designed to make you confident and earn as quickly as possible in live markets.
It starts with the basics of forex trading and moves on to more advanced topics such as risk management, market analysis, and trade execution. The course also includes a live trading session where you can see the techniques being applied in real-time. If you're serious about learning forex trading, sign up now!


Best Forex Brokers
Conclusion: KDJ Indicator
KDJ is a trend-following indicator. Therefore, it works best with trending and not in flat markets. It shows market momentum via a stochastic oscillator.
Scores below 20 indicate oversold conditions, while above 80 points to overbought conditions.
Best results with the KDJ indicator arise with combinations of other complementing indicators: ADX, ATR, and the Bollinger bands.
As a lagging indicator, KDJ has lower chances of false signals when used correctly within conditions that best align with your unique analysis and market conditions.
KDJ Indicator FAQs
What is the most accurate indicator in trading?
There is no indicator that is the most accurate in trading. So, use KDJ for trends plus combine it with other indicators for more insights into analysis and trading.
What is KDJ in Tradingview?
KDJ in Tradingview is a common indicator with the online charting portal


