Currency volatility is depicted by systematic and instantaneous changes to exchange rates in the forex market. Comprehending market volatility can help determine which currency pair to trade.
Traders primarily utilize one of two different volatility measures to predict market action. These include implied volatility and historical volatility.
In this article, we explore historical volatility regarding Ezekiel Chew's position, how to recognize it, demonstrate the high volatility currency pairs to look out for, and reveal the techniques for consistent forex volatility trading.
What is Historical Volatility

Historical volatility (HV) is a statistical indicator of the variation in returns over time for a particular security or market index.
This metric is typically derived by calculating the average deviation from the price of a financial tool within the specified time frame.
HV can evaluate how far a security's price deviates from its standard value. Historical volatility gives a broad outlook of how far traded prices may have departed from a central or moving average price in marketplaces where a dominant trend is present.
Low volatility levels can be expected in markets that are steady and have a definite prevailing trend, even though prices may change over time
The most typical, but not the only, method of calculating historical volatility is to use standard deviation. The riskier the security, the higher the historical volatility value. Risk can go bullish and bearish, so the outcome is not always bad.
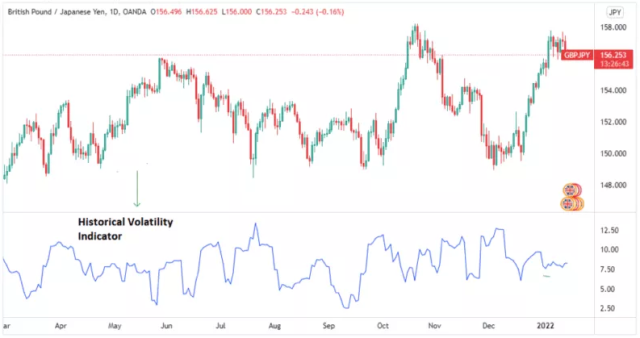
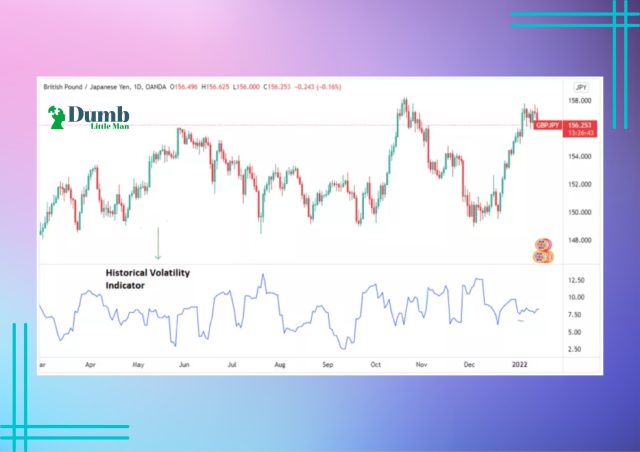
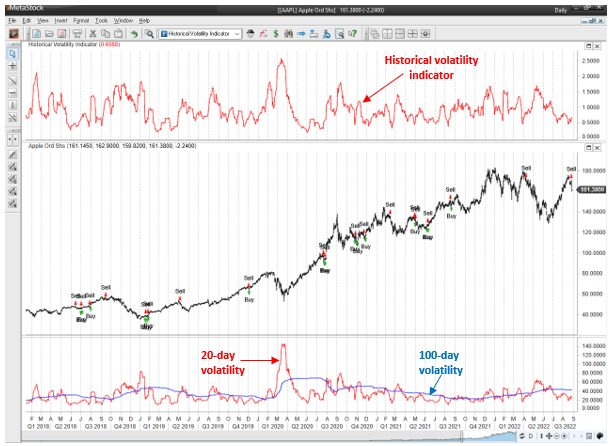
An illustration of a historical indicator on Trading View for the daily GBP/JPY chart is shown above. The “Historical Volatility Indicator” labeled bottom pane is where you can find it.
What does Historical Volatility mean while Trading
As previously noted, there is often more risk when there is high market volatility. Nevertheless, based on the type of trader they are and their level of risk tolerance, investors and traders will all have different perspectives on volatility.
For instance, a more conventional investor who intends to buy shares of a company to hold onto for a long time will probably want to steer clear of anything with high volatility.
This kind of investor seeks out securities they can buy and then leave to potentially increase in value over time without being required to monitor the markets continually. As a result, volatility and the risk it entails will be unsettling.
However, many short-term traders, including scalpers, profit from extreme volatility, which may be a crucial component of their trading tactics. These traders try to make money from a financial instrument's rising and falling prices.
These traders believe that the potential for profit that volatility offers justifies embracing the higher risk. Contrary to our longer-term investors, trading in these circumstances necessitates a trader's increased presence at their trading terminal.
High historical volatility indicates that there are good trading chances, whereas low historical volatility shows that there are few trading possibilities for traders using historical volatility. Reduced volatility indicates lower risk, whereas more volatility indicates higher risk.
Historical Volatility vs Implied Volatility
Volatility is a number that gauges how much a security's price will fluctuate. Generally speaking, risk and reward are inversely correlated with volatility.
Options' premium is low when volatility is low. It's best for an excellent trader to understand how and how rapidly a security's price will move before making a trade.
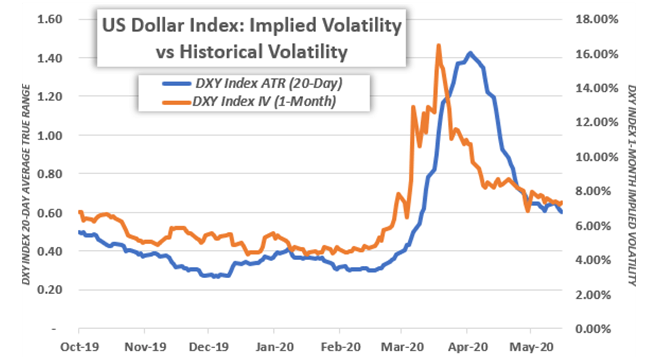
The key difference between historical and implied volatility is, that variations in implied volatility define the relative values of option premiums, and historical volatility measurement always serves as the reference point.
Options premiums are generally thought to be properly valued based on historical standards when the two measurements show similar values. Options traders look for departures from this equilibrium to profit from inflated or deflated option premiums.
Options premiums are considered overvalued, for instance, when implied volatility is much higher than the historical average. When premiums are higher than average, options traders have the upper hand because they can sell to open positions at inflated premiums that show high implied volatility.
When volatility regresses to typical levels and the value of option premiums decreases, the goal is to close off positions at a profit. The purpose of this technique is to sell high and purchase low.
Investors may measure and identify volatility trends using historical and implied volatility, which are essential instruments. Traders can choose whether or not to enter trades after determining the volatility levels for a particular stock, asset, or commodity using a statistical volatility analysis.
It's noteworthy that implied volatility is not an exact science; instead, it is a calculation that allows investors to predict where the market is headed. In contrast, historical volatility does not consider market direction; instead, it measures how much a stock price deviates from its average value, up or down, over a period of time.
What is the Importance of Historical Volatility to Investors
Although volatility can pose a significant risk to an investor's portfolio, it can also produce healthy profits for astute investors when used wisely. It is possible to find an opportunity even when markets fluctuate, crash, or skyrocket.
Historical volatility indicates how far a price may deviate from its average over time. A higher historical volatility value is the outcome of increasing price volatility. It is crucial to remember that the historical volatility statistic shows how unstable a price is rather than the direction of the price.
Traders who exclusively trade underlying financial products can use historical volatility as a tool. A market's level of instability can influence an investor's expectations for how much or how significantly the market might fluctuate, and it can provide some direction for setting price projections and carrying out trades.
For forward-looking option traders, knowing how underlying security functions from past performance, you may better position yourself to comprehend the overall state of the stock market, evaluate the risk associated with any given sell options, and create a stock portfolio that is an excellent fit for your growth goals and risk tolerance against future volatility skew.
How to Calculate Historical Volatility
Variance and standard deviation are frequently used to calculate volatility (the standard deviation is the square root of the variance). The standard deviation is multiplied by the square root of the number of periods in question since volatility represents changes over a specific period.
When determining the standard deviation over time to determine volatility, you can adopt the following procedure using data from the example attached.
Obtain the asset's historical prices.
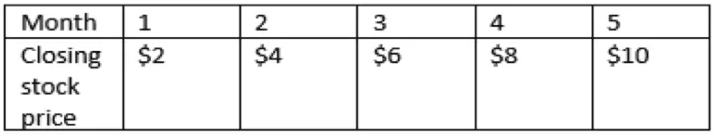
Calculate the projected price (mean) of the historical prices.
Mean = (2 + 4 + 6 +8 + 10 ) / 5. The mean here = 6.
Calculate the difference between the series' average price and each individual price.
(10-5), (8-5), (6-5, (4-5), (2-5) The results are 5, 3, 1, -1, and -3.
Square the results from the previous step.
You will get; 25 + 2 + 9 + 1 + 9
Calculate the sum of the squared differences
25 + 2 + 9 + 1 + 9 = 40
Divide the result by the number of data entries (Variance)
40/5 = 8
Determine the square root of the variance computed which equals $2.83
Best Forex Trading Course

If you have been wondering how to make money in the forex market and improve your personal finance, this is the course for you.
The Asia Forex Mentor will start by giving you an introductory guide on what exactly is the forex market. You will also get some ideas on how to get started, what you need and so much more. After that, the course will give you a detailed guide on how to trade. Now, the author of this course is not just any other guy. Ezekiel Chew is a seasoned trader who has taught a lot of people to make money in forex.
He has also taught some of the leading investment banks on the same. What you get from the course is a complete guide on how to trade like the pros. Of course, you may need extra investment advice, but the most important thing is that you have the basics right.
Everyone wants to make a steady passive income if they can. But you must be ready to seek the knowledge required to do so. The Asia Forex Mentor offers you the perfect opportunity for this. Just go to the main course website, and get started on your forex trading journey.


Best Forex Broker
Conclusion: Historical Volatility
Historical volatility depends on variables like market demand. A security's price and volatility will rise in tandem with an increase in the market's request for the asset.
A security's price will drop as market demand declines, and its volatility will rise simultaneously. Relatively high historical volatility values indicate a comparatively wide range of underlying assets. In contrast, relatively low historical volatility values indicate a relatively narrow range of historical prices.
Historical volatility tracks shifts in market security prices over a predetermined amount of time. It can quantify risk, and traders frequently examine and assess market patterns.
High volatility is frequently thought to have negative implications, but as we observed above, this is not necessarily the case. Finding a middle ground regarding historical volatility is a fantastic place to start trading if you're not ready to gamble.
Historical Volatility FAQs
Is high market volatility good or bad?
Volatility may be beneficial or detrimental for you, depending on your risk appetite and the type of trader you are.
Volatility can cause problems for long-term investors, but it frequently means more trading chances for day traders and options traders.
What is the historical volatility percentile?
Historical Volatility Percentile represents the percentage of the last year's (252 trading days) days with lower volatility than the present volatility.
It incorporates a simple moving average as a signal line to display the stock's current level of volatility.


