
Want to jump straight to the answer? The best forex broker for traders is Avatrade
The #1 Forex Trading Course is Asia Forex Mentor
Undoubtedly, the level of profit a trader can generate utilizing their own-developed technique plays a significant role in determining their level of success. For most traders, a deep study and the ability to analyze trading chart activity employing a flawless approach has been a key to profit-making. Therefore, giving appropriate knowledge of the trade pattern and geometric formation more attention is essential.
Leading forex trader and trainer Ezekiel Chew has stressed the value of the geometric price pattern as an essential tool for all traders. Ezekiel said it is more crucial to make the appropriate choice as a result of those studies than to analyze the chart. In contrast, several traders rely on the custom-developed approach that was successful for them using.
This article will discuss harmonic patterns and how you can profit from them as a successful trader.
What is Harmonic Patterns
Harmonic patterns, which are inherently geometric, rely on using the Fibonacci numbers to predict future price fluctuations and pinpoint exact turning points. Indicators of a reversal or, at least, a corrective zone on harmonic charts can be found in the combination of simple and complex formations of specific ratios and their reciprocals across candlesticks or bars.
Harmonic charts should be used with other techniques and indicators for more accurate results. The application of Fibonacci tools forms the basis of harmonic patterns, which have a unique quality. These patterns can generate precise and trustworthy trade signals. The key is determining the levels at which the general trend will continue following a correction.
Despite how beneficial harmonic charts may be, there are several drawbacks involved, such as the inability of traders to spot them on a graph, lengthy time frames, and high levels of complexity, to name a few. It is more straightforward if traders have a detailed understanding of the Fibonacci configuration before using it.
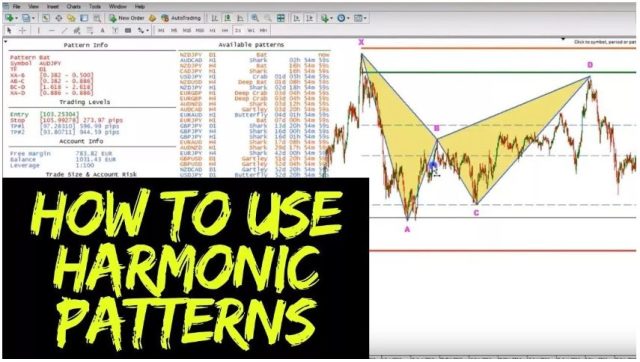
How To Use Harmonic Patterns
Finding patterns of different magnitudes and lengths allows the investor to apply Fibonacci ratios to the stock market patterns when predicting future movements. Many traders have found or contributed to adequate levels and practices that can help to boost harmonic patterns' performance in the stock market.
For that reason, harmonic price patterns tend to be precise. They require the practice to showcase fluctuations of a specific magnitude for the prediction to calculate an accurate reversal point. The Fibonacci level may not coincide with a harmonic pattern that an investor can see. It makes that pattern inaccurate for price prediction as a result. The trader must therefore watch for the price to reach a favorable fluctuation point.
Future price movements can be predicted using the pattern. They can therefore aid in identifying the reversal spots. However, if a trader enters a position at the reversal point, they will lose money, and the pattern is invalid. Because of this, trade with fast-expanding reverse trends might trap the trader. So it would be best to manage risk as you would with other trading strategies.
Fibonacci and Geometric Price Patterns
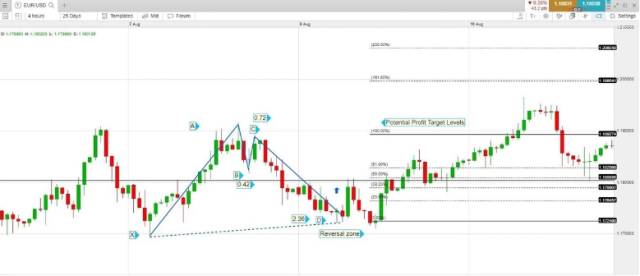
These patterns are based on algebraic principles and are used to establish a directional move in a market by retracing a certain percentage of the previous activity. Fibonacci can be a valuable tool for determining a point of entry during an uptrend. When a significant forex trend begins to wane, traders look to Fibonacci retracements to see where the trend might resume.
In this case, we're looking for a point of resistance to create a better entry point for our trade. We want to sell short, so we can trade in sync when the trend returns. In contrast, when a market price moves into a region where no technique for determining support or resistance zones is suitable, Fibonacci extensions are typically used to establish price targets or locate projected areas of support or resistance.
The Fibonacci trading tool is insufficient, so it must be used with candlestick charts and chart patterns to produce an effective strategy.
The Gartley Pattern
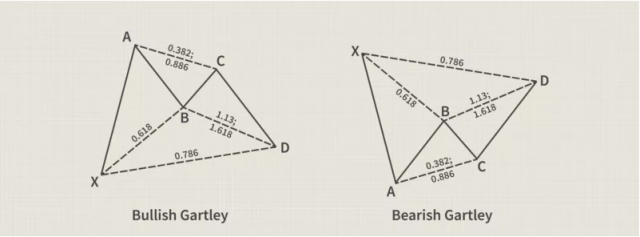
The Gartley pattern is a harmonic chart that helps traders identify reaction highs and lows using Fibonacci numbers and ratios. It is most likely the first and most well-known complex harmonic configuration. Its proportions are simple to remember.
Technical analysts frequently use the Gartley pattern in conjunction with other chart patterns or technical indicators. For example, the pattern may provide a broad overview of where the price will likely go in the long run, while traders concentrate on executing short-term trades in the direction of the predicted trend. Traders can use the breakout and breakdown price targets as support and resistance levels.
The Gartley Pattern might appear uneasy for non-professionals due to its rare occurrences in the market. This, however, necessitates patience and discipline on the trader's part, which in turn creates opportunity costs because other possible transactions might be lost. Additionally, even though the pattern's specificity falls within a range in the Fibonacci ratios, the level of specificity also affects the pattern's dependability.
The Butterfly Harmonic Trading
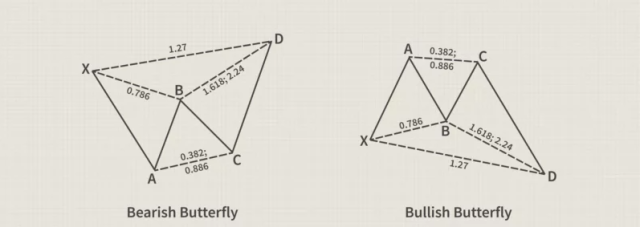
The butterfly chart pattern is a harmonic pattern that works on the same principle as the double bottom and top charts. In layman's terms, this butterfly-shaped technical analysis chart pattern helps traders locate a probable reversal zone after a price consolidation and two peaks, either dropping or ascending.
Like the double top and double bottom patterns, the butterfly chart pattern has four legs with two peaks and two lows or highs (bullish or bearish). Unlike double tops and bottoms, however, the butterfly pattern initiates the trend reversal throughout the pattern's development and is considered a more accurate indicator than many other harmonic patterns.
The Bat Harmonic Pattern
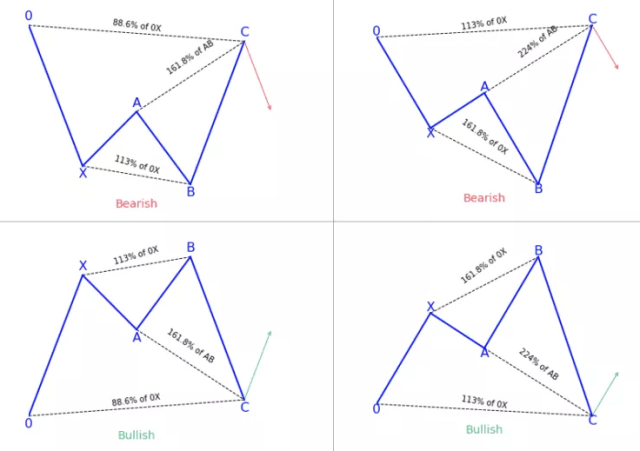
The bat pattern can look the same as Gartley's, but the measurements differ. Here is an excellent bullish illustration.
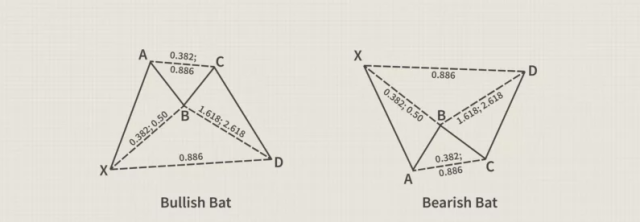
Via XA, there is an increase. B that traces back from 0.382 to around 0.5 of XA. In contrast, BC retraces AB by an average of 0.382 to about 0.886. Therefore, CD is an extension of AB, ranging from 1.618 to roughly 2.618. At 0.886 of XA, D finally retraces.
D typically denotes the region where a trader might wait a while or examine trends before prices increase. Users of bats may also set a stop loss just below it. You can look for the bearish pattern at short D with a stop loss not too far above.
The Crab Patterns
The crab pattern is one of the most accurate and dependable patterns in the eyes of most investors. The Fibonacci numbers suggest that it offers reversals that are very close together. Although it differs in size, it resembles the butterfly design considerably.
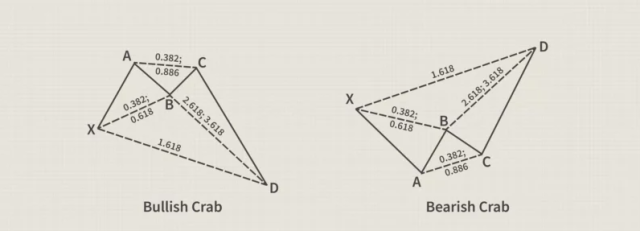
The bullish pattern's explanation shows that point B will retrace from 0.382 of XA to 0.618 of XA. However, the CD can increase from the AB's 2.618 to 3.618. Point D, on the other hand, shows a 1.618 extension of XA. Investors should buy around D and plan a stop loss just below it. For the bearish pattern, they must enter a short with a stop loss just above D.
Stop Losses and Fine Tune Entries
Knowing that no system is 100% accurate, the trader's objective is to discover a strategy that is correct most of the time or at least able to accrue profits. There is always some degree of uncertainty in the markets.
The stop loss is an order you can add to your trading position at any time, either before or after you start trading. Traders can request an automatic withdrawal from a position by placing a stop-loss order. If the price action swings against your trade, your position will be automatically closed when it reaches the pre-specified level.
How Harmonic Patterns Improve Trading

Harmonic patterns can indicate continuation, which tells you when the price will move in the same direction, or reversal patterns, which aid in predicting when the price will change direction or reverse.
Additionally, it can provide a clear indicator of whether the price is forming a bullish or bearish pattern for a more accurate price prediction. To better grasp all the harmonic patterns, it would be best to do further research on them.
Scott Carney discovered that back-and-forth price movements characterize the various financial markets' harmonic patterns. They have three to five legs, or trading points, on each. The legs adhere to exact mathematical proportions.
The Fibonacci levels are used as the primary retracement levels in the majority of harmonic patterns. Each pattern incorporates these retracements and extensions into its concepts to produce a potential reversal zone.
Before purchasing a harmonic scanner, it would be great to learn more about the market trends. Additionally, research is essential for overall stock trading performance. Therefore, it's advisable to avoid relying on automatic alternatives. Before investing in a scanner's tactics, please find out more about it.
Best Forex Trading Course

There is no doubt all these things may seem a bit technical to follow. In fact, the price makes so many wild swings each day that it can be very hard to measure buying pressure or selling signals. Also, learning all the technical analysis you need for forex takes more than just a day. Instead of relying on the odd article here and there, you may want to get a full detailed course to take you through all these situations.
Here is where the idea of the Asia Forex Mentor by Ezekiel Chew comes in. The course is a robust introductory guide that will give you the knowledge you need to trade forex. It's a beginner-friendly guide as well that works for folks who want to trade forex and any other financial asset.
The Asia Forex Mentor will not just teach you how to predict price shifts, daily volume, and these other technical indicators. It will also teach you how to manage capital and explore some of the most advanced risk control measures in the world. After all, as long as you are managing your capital correctly, identifying overbought and oversold pairs will be the easier part.
Also, if you are an advanced trader looking to learn some of the tricks used by leading banks, this course is also ideal. As a matter of fact, The Asia Forex Mentor is developed by someone who has taught some of the leading investment bankers how to trade forex. You will be able to identify a losing trade, gauge price movement under immense trading pressure, and maintain a level head even when the markets are volatile.


Best Forex Brokers
Conclusion: Harmonic Patterns
Harmonic patterns describe the market's top desire for the right shapes. This function allows us to benefit even from the erratic movement of the price. The fundamental guideline for creating harmonic patterns is to stick strictly to the right proportions. Waiting for the ideal figure rather than entering the market is best.
The simple line is that harmonic trading refers to a precise and quantitative method of forex trading that needs patience, practice, and an understanding of the patterns. A keen eye and patience are needed to identify harmonic patterns. Before making a trade, one must not only recognize and compute harmonic patterns but also wait for them to finish.
However, one can benefit from these 5-point reversal structures by employing the proper tools and indicators to help validate ideas and forecasts. When predicting price changes, they are exact. To confirm trends, reversals, support, and resistance, research the market and use additional instruments.
Harmonic Patterns FAQs
What is a Harmonic Scanner?
The harmonic scanner in forex is a tool for spotting patterns that are traded using. Online trading platforms, web applications, and trading platforms for PCs and mobile devices are all accessible for harmonic scanners in forex. Every second, the scanner searches through thousands of stock pairings in search of candlestick patterns, harmonic patterns, chart patterns, and support and resistance levels.
Harmonic patterns are found based on calculating Fibonacci ratios, which define pattern levels. It recognizes candlestick and chart patterns, which are unavoidably suggestive of trading signals in the stock market.
When identifying patterns in the futures and options markets and their high risk, not all patterns may be taken into account. Harmonic scanners offer a trustworthy method for forecasting the trading system, problematic patterns, and prior performance outcomes.
Which Harmonic Patterns is the best?
Several individuals and companies have ventured into offering AI solutions for stock trading. However, it would be preferable to carefully investigate the price and security features before using any equipment. You can easily check the quality of a tool by looking at user experience reviews.
Most importantly, you should pick a tool that is affordable and helps you earn from your efforts. To protect your account, choose a device that has high-security encryption.


