
Want to jump straight to the answer? The best forex broker for traders is Avatrade
The #1 Forex Trading Course is Asia Forex Mentor
A chart pattern, also known as a price pattern, is a pattern that appears when prices are graphed within a chart. Chart pattern studies play an essential part in technical analysis in the stock and commodity markets. When data is plotted, a pattern generally emerges and repeats itself throughout time. It may be utilized as a reversal or continuation indication depending on the chart pattern.
A Forex Chart Pattern is a group of historical patterns in price behavior for a particular currency pair. The following article will explain the Forex Chart Patterns, their types, signals, and their pros and cons in detail. This review also holds insights about the Forex courses that can polish your skills when it comes to trading.
Forex Chart Patterns: What is Forex Chart Patterns?
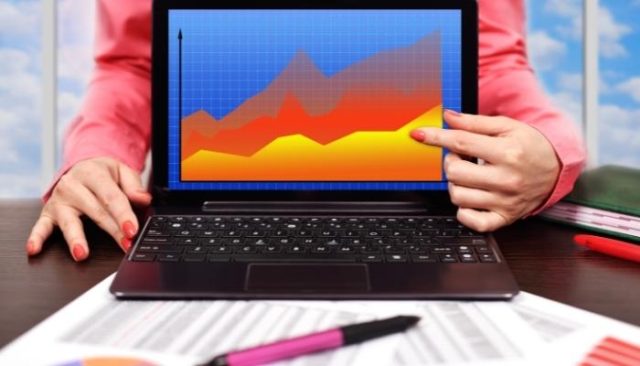
To understand forex chart patterns, forex traders must first grasp the idea of price charts. Any analyst, retail trader, or market watcher will use price charts to measure historical price changes of a particular currency exchange rate. A price chart shows a series of prices through time. Time series plots are how charts are referred to in statistics.
A chart pattern is a distinctive structure on a chart that may be interpreted as a trading signal or a forecast of future price movements. Traders who utilize charts, often known as “chartists,” use chart patterns to spot trends and reversals and determine whether to wait, sell, or buy.
Forex Charts allow traders to essentially look into the past of an asset, and, according to technical analysts, this past behavior might be an indication of what the asset may do next. Forex price charts display historical activity across many different time frames and quantify the movement of the two forex pairs.
Traders utilize indicators such as the Relative Strength Index (RSI) or an Average True Range Calculator (ATR) to attempt and figure out what markets are doing. They also employ Fibonacci and trend analysis as some of the most prevalent movement patterns exhibited on price charts.
What are the different Forex Chart Patterns?

With so many methods to trade currencies, sticking to a few tested strategies can help you save effort, money, and time. A trader can make a complete trading plan employing patterns that occur frequently and are easy to recognize by fine-tuning common and simple strategies with a bit of effort.
The different types of trading chart patterns include various visual indicators on whether to trade or not. These patterns include Head and Shoulders patterns, Triangles, Bearing and Bullish Pennants or Flags, Rectangles, Rising and Falling Wedges, Double or Triple Tops and Bottoms, Candlestick, and Ichimoku Forex Patterns. While some of these approaches are difficult and complex, others are straightforward and take advantage of these patterns' most often traded aspects.
#1. Double or Triple Tops and Bottoms
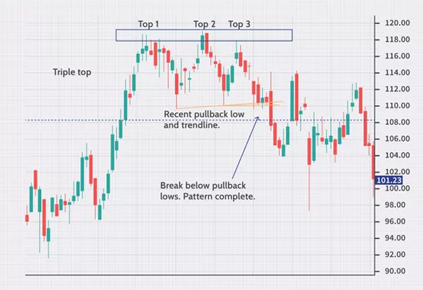
Reversal chart patterns such as Double Tops and Triple Tops indicate that a shift in trend direction is possible. These trading patterns suggest that an uptrend has ended and a downward trend has begun. Double Bottoms and Triple Bottoms occur at market bottoms, indicating that a downtrend has likely ended and an uptrend has started. All markets and time frames have double tops, triple tops, double bottoms, and triple bottom chart patterns.
#2. Head and Shoulders Top or Bottom
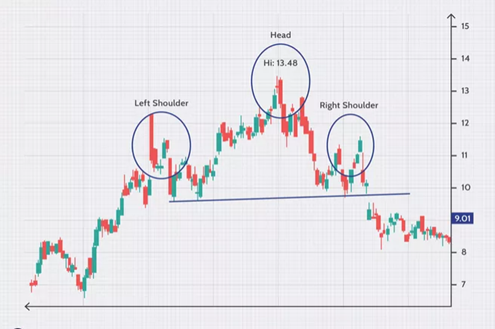
The head and shoulders pattern, which shows a baseline with three peaks, the middle peak being the highest, is a common and easy-to-spot pattern in technical analysis. In addition, a bullish-to-bearish trend reversal is depicted on the head and shoulders chart, indicating that an upward trend is nearing its end.
Traders and investors can employ the pattern because it appears on all periods. In addition, the chart pattern gives crucial and immediately visible levels, making entry levels stop levels and price goals simple to apply.
#3. Rising and Falling Wedges
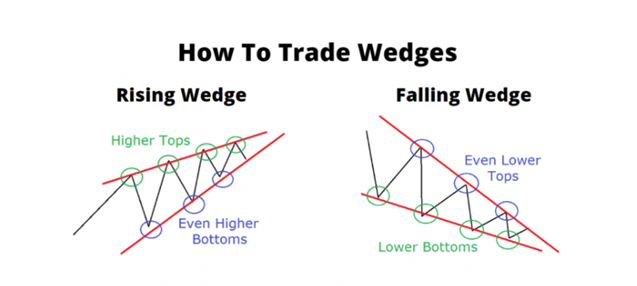
Two trend lines merge in a Wedge chart pattern. This shows that price fluctuation within the Wedge pattern is shrinking. Wedges are a hint that the present trend is coming to a halt.
Because wedges are directional, they can be bullish or bearish. These wedges frequently signal a market reversal. They are generated by a period of consolidation in which the bulls and bears jockey for position, just like other wedge formations.
One of the unique features of this wedge design is that it usually creates easily identifiable levels. As price action traders, this makes our work a lot easier, not to mention more profitable.
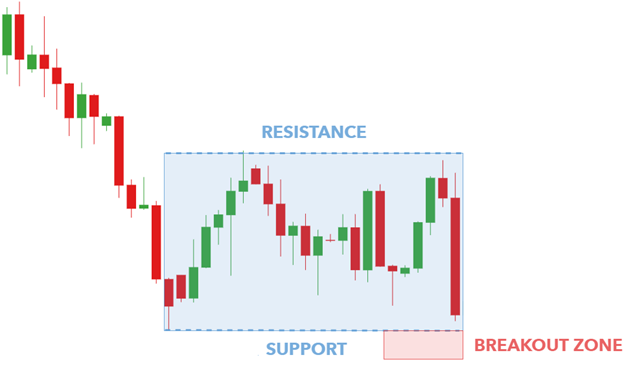
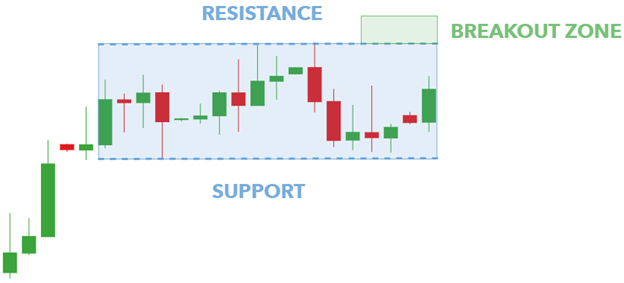
#4. Rectangles
A rectangle is formed on the chart when the price is surrounded by parallel support and resistance levels. A rectangle represents a moment of consolidation indecision between sand sellers, as they trade punches, but neither has the upper hand.
Before breaking out, the price will “test” the support and resistance levels multiple times and later move in the breakout direction, whether to the upside or the downside.
Bearish rectangle pattern:
Bullish rectangle pattern:
#5. Bearing and Bullish Pennants or Flags
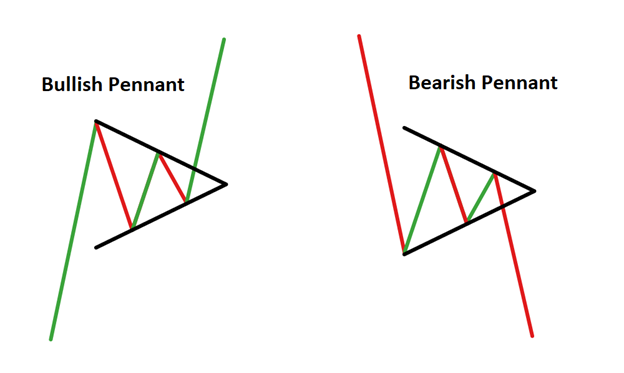
A penny pattern is a continuation chart pattern that occurs when security undergoes a significant upward or downward movement, followed by a brief consolidation before continuing in the same direction. The pattern resembles a Pennant; a little symmetrical triangle made up of several forex candlesticks. Pennant patterns are classified as bearish or bullish depending on the direction of the movement.
While the Pennant pattern is similar to the triangle pattern, there are some key differences that traders should be aware of. An asymmetrical triangle is a chart pattern of two converging trend lines that connect a succession of peaks and troughs. Pennants are continuation patterns that follow a period of consolidation with a breakout.
Pennants are a technical pattern that is used to identify market moves that are expected to continue. When a bear move pauses, a bearish pennant appears, and when a bull move pauses, a bullish pennant appears. Trading them necessitates determining when to initiate a position, take a profit, and close a position.
#6. Triangles
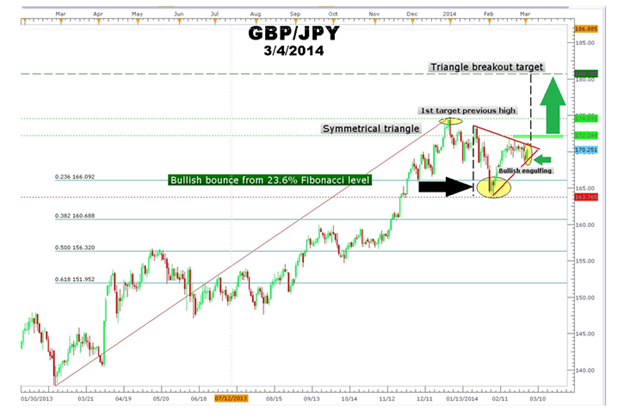
A forex triangle pattern is a consolidation pattern that appears in the middle of a trend and typically indicates that the trend will continue. As price advances in a sideways manner, a triangle chart pattern is constructed by drawing two converging trend lines.
As a signal to enter a trade, traders frequently seek the following breakout in the direction of the prior trend. Triangle patterns are found in the forex market in three different variants. Traders can use these patterns to predict future price movement and the possibility of continuing the present trend. However, not all triangle forms may be read the same way, which is why it's critical to comprehend each triangle pattern separately.
Symmetrical Triangles:
All versions of the triangle pattern may be seen as originating from the symmetrical triangle. After creating two converging trend lines on a chart, a triangle appears, as the name indicates.
Symmetrical triangles are distinct from the other triangle designs in that they are neutral chart patterns that do not lean in either direction. While the triangle is neutral in nature, it nevertheless supports the existing trend's direction, and traders wait for price breaks in that direction.
Ascending Triangle:
The ascending triangle trading pattern is identical to the symmetrical triangle pattern, with the exception that the upper trend line is flat and the bottom trend line is rising. As prices continue to hit higher lows, this trend shows that buyers are more aggressive than sellers. The more occurrences of price approaching the flat upper trend line, the more probable it is to break through to the upside.
Descending Triangle
On the other hand, a declining upper trend line and a flat lower trend line describe the descending triangle pattern. As prices continue to hit lower highs, this trend shows that sellers are more aggressive than buyers.
Directional Movements
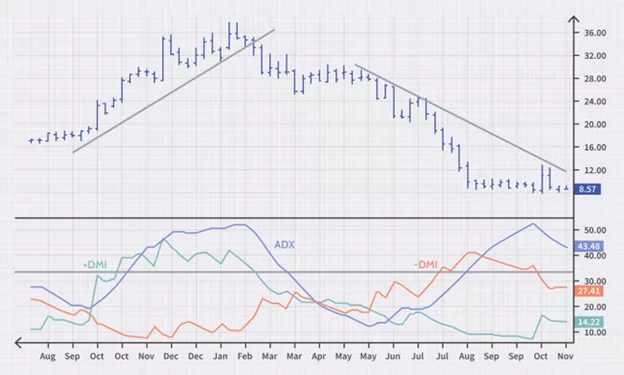
Directional movements are trading indicators that calculate the growing momentum of the highs in an upmarket and the dropping momentum of the lows in a down market using the high/low momentum.
The directional movement index (DMI) is a 1978 indicator invented by J. Welles Wilder that shows how an asset's price is moving. The indicator does this by creating two lines: a positive directional movement line (+DI) and a negative directional movement line (-DI) based on previous highs and lows (-DI). The average directional indicator (ADX) is an optional third line that may be used to determine the strength of an uptrend or downturn.
When +DI exceeds -DI, the price is under greater upward pressure than downward pressure. If the -DI is higher than the +DI, the price is under more downward pressure. This indicator can assist traders in determining the trend's direction. Crossovers between the lines are occasionally utilized as buy or sell signals.
Uptrend
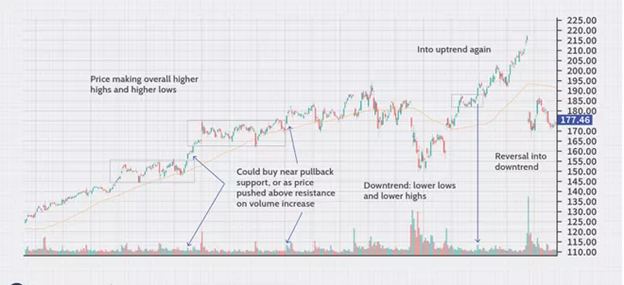
The Positive Directional Indicator (+DI) is a component of the Average Directional Index (ADX) that is used to determine if an uptrend is present. When the +DI slopes higher, it indicates that the uptrend is strengthening.
Downtrend
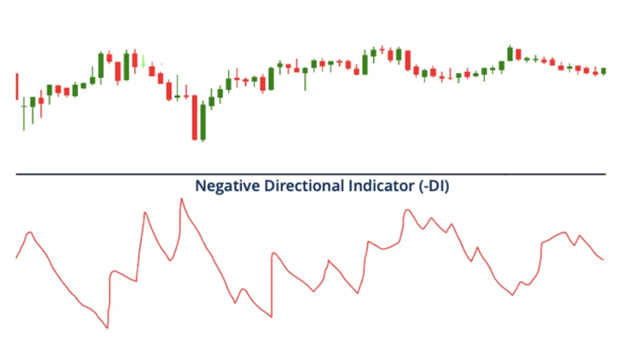
The Negative Directional Indicator (-DI) is a component of the Average Directional Index that assesses the presence of a downtrend (ADX). If the -DI is trending higher, it indicates that the price downtrend is becoming more pronounced. The Positive Directional Indicator (+DI) is almost often plotted with this indicator.


Forex Chart Patterns Pros and Cons
Pros
- Simple tax rules
- Fewer commissions and fees
- Automated strategies
- One of the most accessible marketplaces.
- Trading liquidity is frequently plentiful, especially in large currencies.
- Potential For Fast Returns
- Easy Short Selling choices
- Technical analysis works effectively in the currency market.
Cons
- Small Traders May Face Some Disadvantages
- Short-term earnings may be susceptible to high volatility at times.
- Fewer Residual Returns
- Lesser Regulatory Protection
Best Forex Trading Course

Investing in the Forex market might seem to be a daunting task especially if you are a beginner, and have just started exploring the Forex market. Although experience is said to be the best teacher when dealing in the Forex market, it is good to learn about the Forex market briefly before making your first investment.
There are several ways in which you can start expanding your knowledge of the stock market. You can either start reading books or ask for tips from your friends or family members who have prior experience of trading on the Forex platform. However, the former is a time-consuming method while the latter is not always a credible learning source.
If you want to learn about investing in the Forex market that would help you gain knowledge, and tell you all you need to know about the market, then you can opt for some professional courses available on the internet. These courses are developed by Forex markets experts who have years of training Forex traders.
Now, there are thousands of courses on the internet that claim to teach you about Forex investment. However, not all of these courses are reliable and give accurate information. So which is the best Forex course for learning the ins and out's of the Forex market?
Asia forex mentor course by Ezekiel is by far one of the best Forex learning courses on the internet, and they are one of the best learning sources if you want to expand your Forex trading knowledge.
They have been featured on multiple different leading forex platforms and Forex events happening around the world. Ezekiel's platform is the perfect solution for you to learn because their clients include multiple trainees and bank traders from private trading institutions around the globe.
It is the number one course available on the internet because it also reaches new bank traders and has fun managing if you want to make money from trading forex stocks and other commodities.
You can get a great return on investment by indulging yourself in this systematic course. Even if you are a beginner in the field and do not have enough experience and knowledge about Forex trading, you still join this program with zero knowledge. Everything will be taught to you from scratch, and you can enroll yourself in this program right now to get started.
Check out the testimonials on the website and start your Forex trading journey right away. The good thing about this course is that you will be crystal clear about what you need to do from day one.
They are using a return on investment approach to teaching their students. It is a scientific method of beating the market, and you will not be taught this somewhere else.
Best Forex Brokers
Conclusion: Forex Chart Patterns
For anybody interested in establishing a forex trading profession, it's vital to properly analyze the pros and drawbacks outlined above. If the drawbacks of forex exceed the positives for you, then it may be preferable to hunt for a more acceptable line of employment.
People may, nevertheless, be able to make a living in the foreign exchange market. For those willing to take on the challenge, the ability to conduct forex trading independently and remotely is genuinely life-changing. It is feasible to make a decent career trading major, minor, or exotic currency pairings if you have enough risk capital, connection, and a reliable forex brokerage service.
Forex Chart Patterns FAQs
What is Trading?
Trade is a fundamental economic term that entails the buying and selling of goods and services, as well as the payment of a price by a buyer to a seller. Trading may also refer to the exchange of goods or services between parties. Within an economy, trade can take place between consumers and producers.
A trader is a person who engages in the purchase and sale of financial assets in any market. They can purchase or sell for themselves or on behalf of another person or organization. The major difference between an investor and a trader is the length of time for which the asset is held.
A trader is someone who sells and buys stocks in the short term. It can either be for an institution or for personal gains. Some of the drawbacks of trading include the existence of capital gains taxes and the other associated broker fees with varying rates.
What is Stock Platform?
A stock platform is software that allows you to trade while opening, closing, and managing market positions using financial intermediaries similar to an online broker.
Brokers typically provide online trading platforms for free or at a reduced charge in return for keeping a funded account and/or performing a certain number of deals per month. The finest trading platforms combine strong functionality with cheap expenses.
What does Broker do?
A broker is a link between an investor and the stock exchange. It serves as an intermediary that provides the investor with market analytics and allows them to make well-researched and planned investment plans. In addition, since only those individuals and institutions members of the stock exchange are allowed trading, brokers are an entry door for traders. However, in return, they are entitled to commissions and fees.


