
The Force Index Indicator is a popular technical indicator that measures the power behind price movements based on three factors i-e direction, volume, and extent. Alexander Elder, a trader, and psychologist developed this technical tool. The forex index is a part of the oscillators family and is considered a leading indicator, which means it can help identify market reversals before they happen.
A forex indicator can help your trading efforts as it reveals optimal windows of opportunity for trade placement in a bearish and bullish market. Besides, the Elder Force Index will help you understand whether a currency is overbought or oversold.
To better understand the Force index indicator, we have got Ezekiel Chew, the CEO and Head of Training at Asia's largest forex education company, Asia Forex Mentor, to share his take on this technical tool. His insights are extremely valuable for anyone who wants to make the most out of their trading.
Let's discuss the force index oscillator, it's working, how to calculate its formula, usage, and more. So, let's get started.
What is Force Index Indicator?
Force Index is an oscillator that fluctuates between positive and negative territory, which aids in technical analysis. The Elder Force Index is a formula that uses volume and price to evaluate the capacity behind potential turning points. The power of bulls and bears, as well as their influence on market movement, is also measured by the Elder Ray index.
The elder force index indicator has three key features that analyze the trading volume, how prices are trending, and how much prices fluctuate. First, the result of the elder's force index being in play with a moving average is the substantial change in the bull's and bear's power.
When Elder combined the moving average, solitary indicator, and force index, he looked at the technical analysis that pointed to great success. For example, the elder force index is the result of comparing the current price against the prior period's prices, where that result is then multiplied by volume.
Large force index reads occur with strong price moves and high volumes. Conversely, when the elder force index is stagnant, this suggests that while prices might be moving, volume is low.
Force Index Indicator – How does it work
The force index is the result of calculating the previous day's close from the current day's close and multiplying that figure by today's volume. The force index is positive when the current day's closing price is higher than yesterday's and negative when it is lower.
The force index is calculated using the volume and price changes over the most recent two weeks. As a result, both circumstances may independently impact the value and change in the force index.
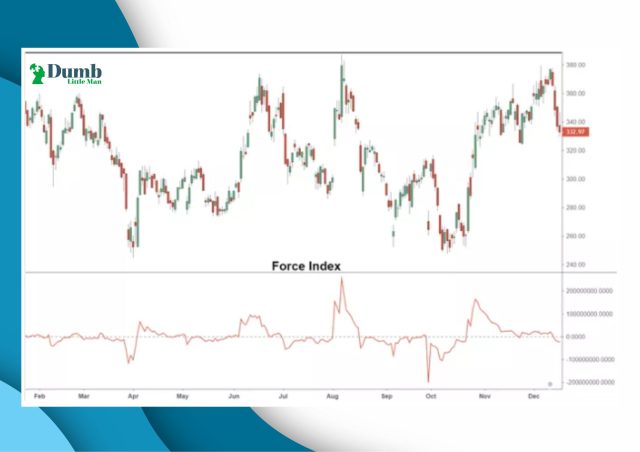
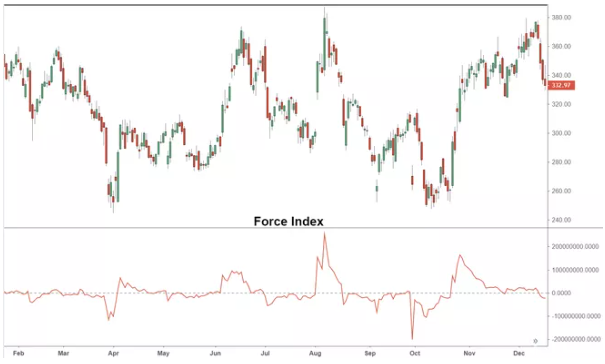
A histogram is a graphical representation of raw data that includes the force index. The centerline is always placed at zero, with positive values above it and negative values below. The negative force index is caused by the lower market and is strategized just below the centerline.
The force index is on line zero when the market is unchanged for that day. The histogram has a raw line that measures the daily changes, but a moving average smoothes it.
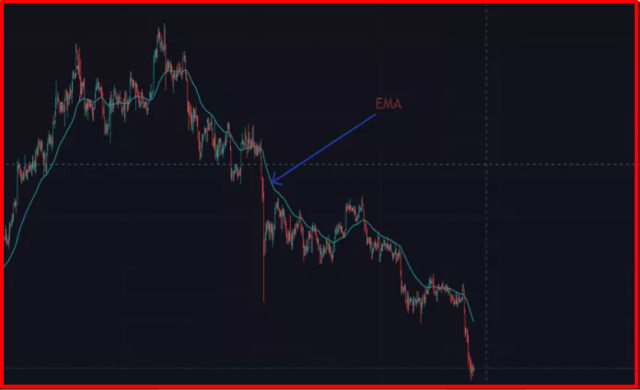
You may wish to use a two-day exponential moving average at the very least. You could also want to use an EMA to smooth things out on a good level.
How to Use the Force Index Indicator
Alexander Elder's trading rules were based on two separate Forex Index indicator moving averages. The particular combination was a 2-day EMA as a short-term directional signal and a 13-period EMA as a long-term trend predictor.
Alexander Elder argued that when an intermediate-length moving average of the elder force Index indicator rises to a new high, bullish divergence forces are growing in the market. This implies that an upward trend is likely to continue.
When the 13-day EMA of the Forex Index lowers to new depths, it signifies a growing number of bearish divergences in the market.
This suggests that the current down trend is likely to continue. If price changes are not supported by volume, the intermediate-length EMA of the force index will flatten out. It only happens if large volumes only see small price changes. When the elder force index flatlines this way, it usually indicates that a reversal is near.
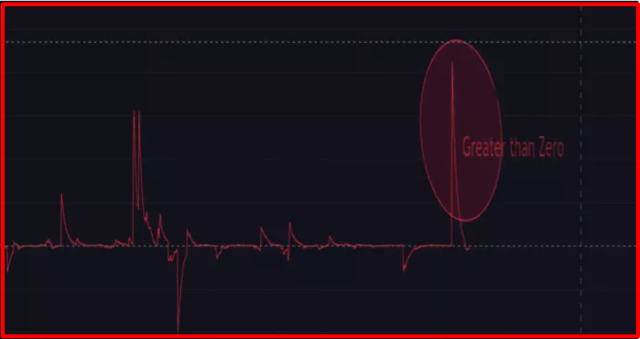
The 2-day EMA shows whether bulls or bears currently have the upper hand in the market, depending on where it is swinging. If it swings above the zero center-line, this indicates that bulls are currently ascendant. However, bearish forces are currently in control if it swings below the center line.
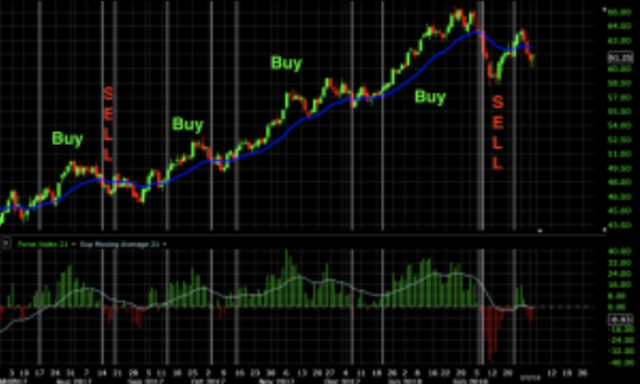
This is used to find potential entry points based on the trend confirmation provided by the 13-day EMA. When the 13-day EMA shows an increase, you're looking to buy. The 2-day EMA swinging into negative territory defines when to enter.
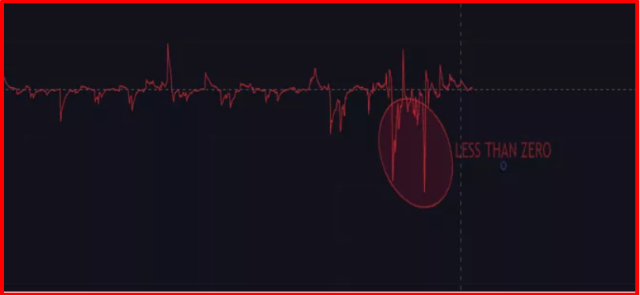
When the 13-day EMA indicates a downtrend, you are looking to sell. The 2-day EMA swings above zero and gives a sell signal.
The Force Index indicator can assist you in determining when important market changes will occur. For example, when the 13-day EMA of the Force Index reaches a higher high, it confirms an uptrend (and new lows would confirm a downtrend).
If the 13-day EMA of the Forex Index indicator differs significantly from the price, this may signal that an upcoming trend is about to reverse.
A bearish signal occurs when the market price reaches a new high, but the Force indicator only creates a lower peak. It suggests that the upswing is ending and that bearish forces are on the verge of regaining the upper hand.
How to Calculate Force Index Indicator
The force index indicator uses price action and volume force index to compare the current market price with a past market price. In addition, it multiplies this by volume over that same period. Based on the formula shared below, the indicator signals potential changes in price direction by measuring the strength of price movements.
Below is the force index indicator formula:
FI(1)=(CCP − PCP)∗VFI(13)=13-Period EMA of FI(1)
where;
- FI = Force index
- CCP = Current close price
- PCP = Prior close price
- VFI = Volume force index
- EMA = Exponential moving average
The EMA formulates the one-period force index. The formula above is used to obtain previous data points. The indicator is additionally calculated as an average of the values that have previously occurred.
The current facts weigh more than previous ones since the EMA is used. Therefore, the technical indicator, Force Index (n), is calculated using the n-period exponential moving average of force index (x).
Alexander Elder recommended that the charting software's default setting is a 13-period exponential moving average. However, the user can change this depending on their preference.
The built-in force index indicator on most trading platforms nowadays eliminates the need for you to compute the values manually. Arguably, the most vital usage of the force index indicator is to identify breakouts and potential trend changes. In addition, it produces readings that tell the trader about the strength of a current movement as values move from a positive to a negative range and back in both cases.
Examples of Force Index
Below are the examples that are solely focused on short and long-term trades:
For Short Trades
- The EMA went to neutral or beyond the zero line when the trade started
- Index EMA is moving in the wrong direction, or the falling force index has decreased
- The EMA of price was negatively sloped
For Long Trades
- When the EMA becomes neutral, or the force index falls below zero, it indicates that Sell was rejected
- Index EMA sloped positively or force index increases
- EMA of price positively sloped
Best Forex Trading Course

Ezekiel Chew is a highly respected figure in the forex trading world. He is a veteran trader and trainer behind trading institutions and banks. And his Asia Forex Mentor program is one of the most popular forex trading courses available today.
The course covers everything from basic forex concepts to advanced trading strategies. Ezekiel's course combines fundamental and technical analysis. This makes it one of the most comprehensive forex courses available.
Ezekiel is a highly experienced trader and trainer. He has worked with some of the world's biggest banks and trading institutions. His knowledge and experience are second to none. Moreover, his trading methods are backed by mathematical probability. This makes his Asia Forex Mentor program one of the most credible and reliable forex courses available today.


Best Forex Broker
Conclusion: Force Index Indicator
The Force Index works by helping traders determine how prices are likely to move according to volume. Even though it's an oscillator, the indicator wasn't made to determine if conditions are overbought or oversold. Instead, it mostly just shows a trend-following occurrence.
The only time compressions that should be used with this method are the daily chart and higher. This is because inputs like the daily high and low aren't automatically recorded on a sub-daily time chart.
Longer-term traders should use longer timeframe settings to keep their positions for weeks or months (e.g., 50 periods or more). On the other hand, Shorter-term traders, who may keep investments for only a few days at a time, would benefit from shorter period settings (e.g., below 20 periods).
As oscillators and other indicators that derive their data from the past are lagging by nature, the index should not be solely relied on. Furthermore, the force index is not the only indicator that can be utilized to improve signal filtration. Other techniques, such as moving averages and price analysis, can also be helpful.
Force Index Indicator FAQs
Is Force Index Profitable?
The Force Index is a trend-following indicator, so it can be used to make profitable trades in both rising and falling markets. In addition, traders can use the indicator to confirm the strength of price movements and make better decisions about when to enter and exit trades.
Who developed the Force Index?
The Force Index is an oscillator tool created and developed in the Trading with a Living book. Consequently, three elements drive market movements. They are the direction of price change, the extent of that change, and trading volume.


