

Want to jump straight to the answer? The best forex broker for traders is Avatrade
The #1 Forex Trading Course is Asia Forex Mentor
Forex traders have used simple price patterns for years to create effective and profitable trading strategies. The ultimate goal was to predict future price movements so they could buy or sell at the right time and make a profit. However, these traditional patterns have suppressed the diamond chart pattern.
The diamond chart pattern is a relatively new addition to technical analysis but has quickly become a favorite among traders. It is present in the currency market and other markets such as stocks and commodities. At significant advances, the diamond top is generally observed. It precisely forecasts approaching shortfalls and retracements with the corresponding accuracy.
To better understand the Diamond chart concept, we have got Ezekiel Chew to share his take on the diamond chart patterns and how to trade it. Ezekiel is the CEO and Founder of Asia's Largest Forex Education company – Asia Forex Mentor. With 20 years of trading experience, Ezekiel has mentored thousands of students from different countries and transformed their lives financially. In this expert guide, we will learn everything about Diamond chart formation, bullish and bearish diamond patterns, and more. So, let's get right into it.
What is Diamond Chart Pattern?
The diamond chart is a reversal pattern created when an asset's price moves up or down in a zig-zag motion and forms a diamond shape. The pattern is created by two converging trend lines that form a symmetrical triangle. The diamond pattern can be bullish or bearish, depending on the direction of the breakout point.
A bullish diamond chart is created when the price breaks out to the upside, and a bearish diamond pattern chart is created when the price breaks out to the downside. The breakout is usually accompanied by increased volume, which confirms the validity of the pattern.
The diamond chart pattern is considered a very reliable reversal pattern and can be used to trade both continuation and reversal setups. It is most commonly seen on longer-time frame charts such as the daily and weekly.
With the currency market's rising cash flow, finding this pattern in the currency market is considerably faster than in its value-based equivalent, where gaps in price action are common, pushing some requirements for identifying the diamond top out.
The diamond pattern can be used in daily and hourly charts at any time frame. The major fluctuations in the forex markets will provide ample options to locate the pattern and trade accordingly.
Comparing Diamond Pattern to Head and Shoulders Pattern

The diamond formation is distinct and resembles a head and shoulders pattern. However, because they are almost identical, it's simple to confuse the diamond pattern with the head and shoulders design.
All the offset characteristics of head and shoulder charlatans are available in a diamond top. The head and shoulders pattern is created by three peaks, while the diamond formation has four. Furthermore, it is recognized by the head position close to the shoulder and the tail near the right.
The ideal time to make a trade is after you've completed the pattern. The breakdown is most likely to occur at the creation of the diamond, and shorting at the end of the right shoulder may be advantageous.
Stop loss enables brokers to prevent losses if the examined pattern breaks down. It's best to set your stop loss at the peak before the diamond closes.
The ideal exit is the shoulder with the greatest crest and deep crevice in the pattern, with the highest development. The breakdown of the diamond pattern provides more profit potential than simply the difference between the crest and channel, but it also exposes you to greater risk.
Bearish Diamond Formation
The bearish diamond pattern is created when the sequence of up and down price swings forms a diamond shape. The pattern is created by two converging trend lines that form a symmetrical triangle.
To produce a trendline, the left shoulder and head combine to form a trendline, and the head is joined to the right shoulder to create another.
The trendlines for the top section of the bearish diamond top formation are formed by price action. Traders can join swing lows within the channel that forms the V shape, while the lower portion is where traders may connect the swing highs in the channel.
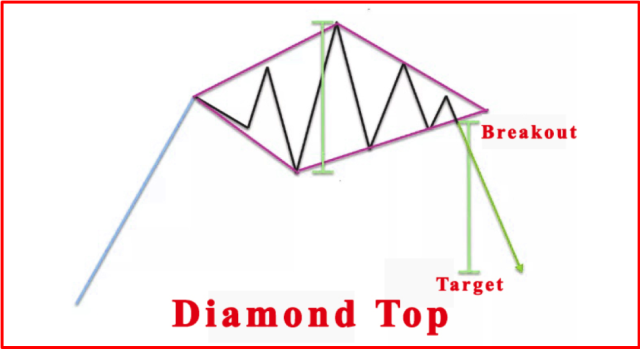
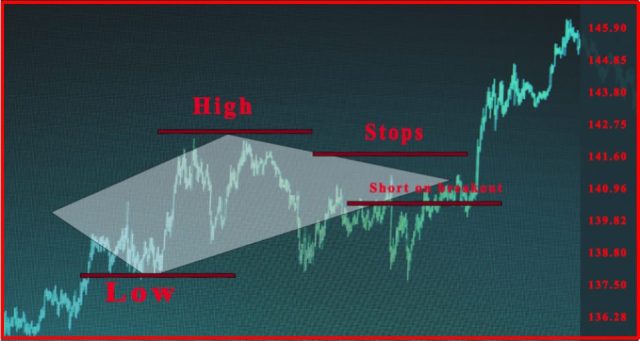
In the above image, you can check the bearish diamond patterns, the breakout signals displayed, and the pattern's target level. The stock closed below the lower right-hand line sloping upward, triggering a short entry signal opened at the break and settled under the higher right-hand line.
Investors are prone to anticipate the breakout underneath this line without considering a close below it. Therefore, this is also a possible entry point, but remember that subsequent deceptive signals related to foreseeing the breakout and closing conditions will result.
To summarize, the formation breakout is evaluated with a measured move approach that estimates the peak-to-valley length of the structure and then displays this span from the breakout point downward.
This takes us to a point where we may anticipate the breakout follow-through to begin retreating or possibly reversing. This implies a decent profit exit point level and a trade exit strategy.
Bullish Diamond Formation
The bullish diamond pattern is the polar opposite of the bearish diamond top, as it forms during periods of downtrends. A downward price movement generally comes next, and a unification stage separates the up and down swing points of the diamond bottom chart pattern.
This appears to be a reversed head and shoulders formation. Traders should recreate the formations' crests and channels in the same way as previously stated.
When the four trend lines are drawn around the structure, it may be determined that the four lines are approximately equal in form and thus that the structure is a bullish diamond pattern.
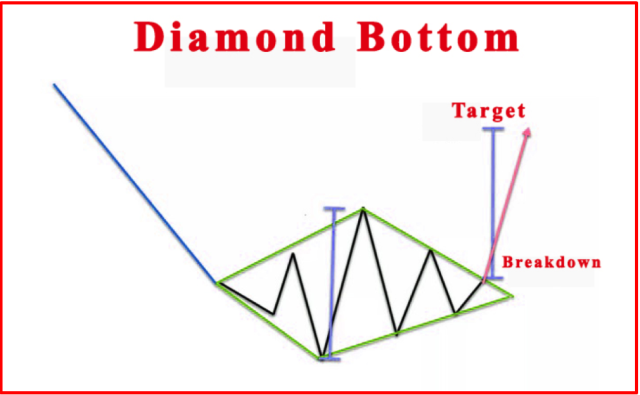
In the above image of a bullish diamond pattern, you can check the structure foreshadowed by the downward price movement.
The two upper trendlines evading downward and the two lower trendlines proclaiming upward combine to form a down-up arrangement in the diamond structure.
This may be observed by the up-down arrangement in the diamond structure defined by the two upper trendlines demonstrating downward movement and the two lower trendlines announcing progress.
The long entry signal is triggered when the price breaks and falls below the upper right-hand line sloping downward.
Instead of just breaking over this trendline to prevent the formation of incorrect indicators and probable whipsawing price action, a typical approach is to anticipate a genuine breakout and close instead.
The high-low range is a way to determine the higher price objective by calculating the highest low against the lowest high inside a restricted environment. If the stretch is calculated and shown on the chart, it may indicate that it covers the same length as the breakout point upwards towards your planned goal level.
When the price reaches this level, investors must expect to sell at least a portion of their position or perhaps some profitable trading possibilities if desired.
Diamond Pattern Trading Strategy
Before you apply the diamond pattern, it is crucial to understand how to implement a trading strategy. First, investors can easily confirm the diamond form patterns on the chart. After that, investors may enter the market if the starting line of diamond chart patterns is broken, placing a stop loss at or below the closing top.
The diamond's investors must remain in the market for a minimal price fluctuation to keep the diamond balanced. Before we reach our goal, we can easily dismiss the VWMA breakout.
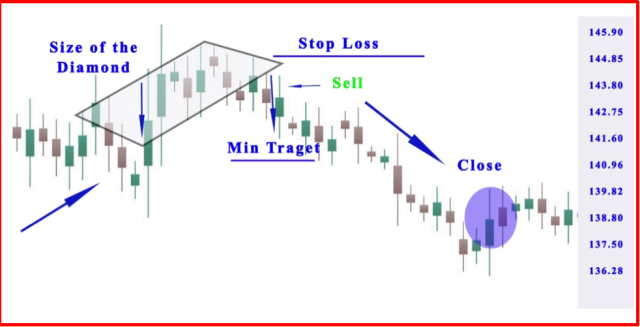
Here is a trade example of a diamond pattern:
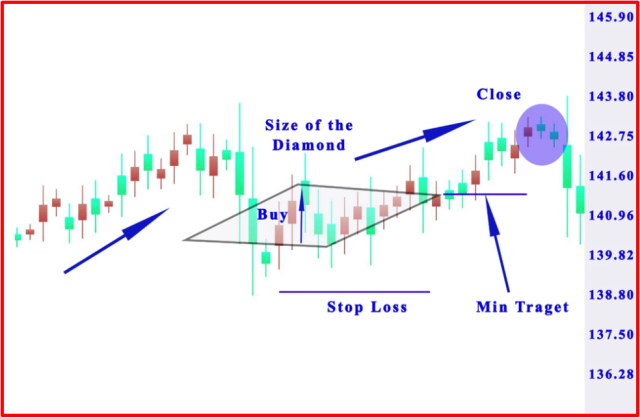
You can check the arrow in the image that calculates and uses the diamond dimensions for the target investment. Traders can employ the VWMA to help them get more profits from their investments.
The volume indicator is in the lower part of the chart, allowing you to see how many transactions there have been. Also, when the price actions go over the right side of the diamond pattern, traders should put a stop loss to protect their investment and take profit when the target is hit.
It is essential to realize that you will not always find a volume confirmation for this breakout, but it is still a valid trade idea.
On the other hand, the diamond chart pattern forms approximately high volumes. That's why traders confirm the bullish trend's existence. A bearish price breakout occurs, which quickly breaks the support level. When the three periods have elapsed since the start of the long trade, it is time to close it.
Let's have a look at the bullish trade diamond pattern:
The above example explains the volatile fictional assets:
The pattern is a bearish diamond chart formation. Since it is more volatile and causes a greater bearish price move, it can often be found in the 4-hour and daily timeframes.
It is verified when the price exceeds the pattern's lower border. Then, the indicator is used to sell the stock—short selling the stock and setting a stop loss, as shown in the above image.
After that, the price begins to fall. Then, after half an hour has passed since we put our bet down on the stock, the price action reaches our target. Still, by remaining in the trade, we can improve profits.
You can observe that the price declines more and the volumes are increasing. This instructs extra verification of the diamond pattern and the presence of a bearish diamond pattern.
Using a Price Oscillator

The price oscillator is an indicator that helps measure an asset's overbought and oversold conditions. Applying it to the diamond chart pattern will let us know when it is time to buy or sell the investments we are interested in.
However, it is important to confirm the diamond pattern and signal. Price oscillators are a type of technical analysis. They may be used to measure momentum in the market and can be used to verify the breakdown of support or resistance.
Best Forex Training Course

There is no doubt all these things may seem a bit technical to follow. In fact, the price makes so many wild swings each day that it can be very hard to measure buying pressure or selling signals. Also, learning all the technical analysis you need for forex takes more than just a day. Instead of relying on the odd article here and there, you may want to get a full detailed course to take you through all these situations.
Here is where the idea of the Asia Forex Mentor by Ezekiel Chew comes in. The course is a robust introductory guide that will give you the knowledge you need to trade forex. It's a beginner-friendly guide as well that works for folks who want to trade forex and any other financial asset.
The Asia Forex Mentor will not just teach you how to predict price shifts, daily volume, and these other technical indicators. It will also teach you how to manage capital and explore some of the most advanced risk control measures in the world. After all, as long as you are managing your capital correctly, identifying overbought and oversold pairs will be the easier part.
Also, if you are an advanced trader looking to learn some of the tricks used by leading banks, this course is also ideal. As a matter of fact, The Asia Forex Mentor is developed by someone who has taught some of the leading investment bankers how to trade forex. You will be able to identify a losing trade, gauge price movement under immense trading pressure, and maintain a level head even when the markets are volatile.


Best Forex Broker
Conclusion: Diamond Chart Pattern

Several profitable and technical traders use the Diamond chart pattern to make money in the market. The strategy can be employed on any timeframe, but it is most commonly seen in the 4-hour and daily timeframes.
The key to success with this strategy is to ensure that you confirm the pattern and signal before making any trades. Remember, a price oscillator is the best way to confirm the pattern.
Once you have confirmed the pattern, you can then enter a trade. For a bullish trade, you buy the assets when the price exceeds the pattern's lower border. However, for a bearish trade, you should sell the assets when the price exceeds the pattern's upper border.
Based on the trader's experience, it is known that the diamond top chart pattern forms after the potential growth in the market price for higher profitable trades. However, you can also test to determine if inclinations and reversal patterns are more profitable.
The pattern can also be found in the forex market, so don't limit yourself to only stocks. Instead, try to find the pattern in other markets as well. You should learn the Diamond trading strategy quite easily with a little practice.
Diamond Chart Pattern FAQs
Is the diamond chart pattern profitable?
Diamond chart patterns mostly occur at a market top. Therefore, if identified rightly, it can be highly profitable to use reversal strategies.
Is diamond top bullish?
No, only the diamond bottom pattern is seen as a bullish indicator.

