
The practise of buying and selling stocks within a short time frame can be overwhelming for a lot of traders. Fortunately, there are plenty of resources and tools available to help day traders identify profitable trades and master their day trading strategy. However, it can be overwhelming for an inexperienced trader to choose from among the limitless options of software and features out there. As a day trader, you want to find a couple of valuable resources that provide a complete technical picture of the stock market combined.
To help you with your decision, let's take a look at the best technical analysis indicators.
What Is Technical Analysis?
Both new and experienced traders alike should use technical analysis to make better decisions and improve their trade strategy and performance in the stock market.
In essence, an analysis of financial markets explores the intricacies of supply and demand.
Technical analyses are typically based on factors that analyze movements in financial markets. It focuses chiefly on technical indicators that monitor price action, volume, and other market trends. Out of these, price action analysis tends to be the leading indicator that most traders look for.


Best Indicators For Day Trading: Important Ones
Technical indicators reveal a lot of information crucial to a day trader's success. Whether the indicator analyzes price action, volume, or other financial data, here are some of the most effective technical indicators for day traders to consider.
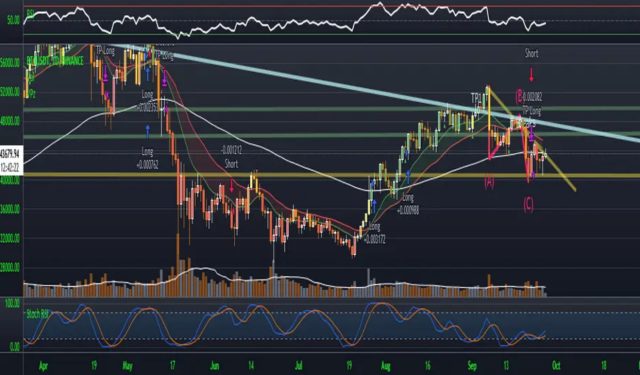
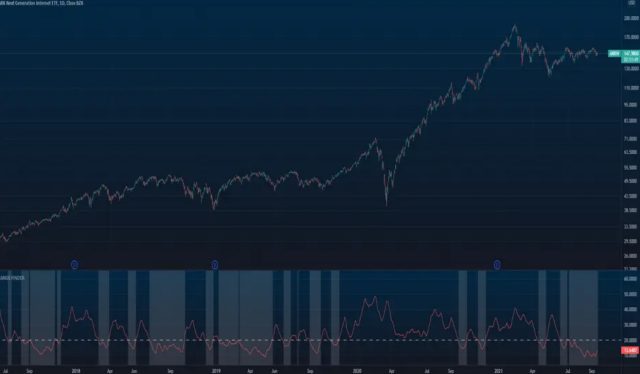
1. Squeeze Pro Indicator
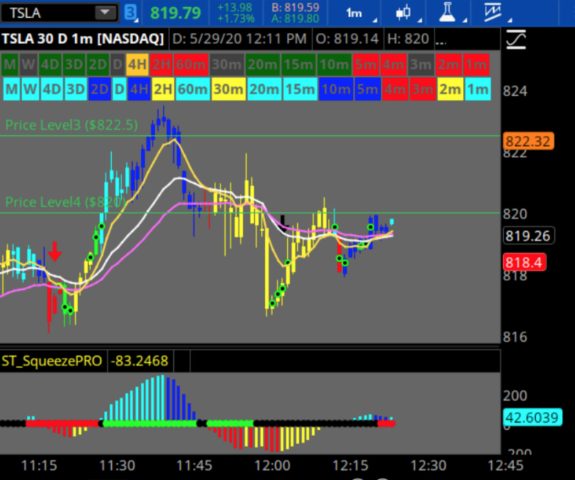
The Squeeze Pro Indicator is one of the most effective technical indicators available to day traders. It automatically adapts to market volatility.
The indicator represents three different types of squeezes: low, mid, and high compression squeezes.
Since the Squeeze Pro Indicator is suitable for both long and short time frames, day traders can take advantage of it to consistently find high-profit intraday setups.
While many platforms offer a squeeze indicator, the Squeeze Pro Indicator at Simpler Trading is an absolute game-changer for day traders.
CLICK HERE TO READ MORE ABOUT SQUEEZE PRO INDICATOR
2. Relative Strength Index (RSI)
The relative strength index (RSI) is a technical momentum indicator that measures the extent of price changes.
It was initially developed by J. Welles Wilder in his 1978 book, New Concepts in Technical Trading Systems. Afterwards, Andrew Cardwell added positive and negative reversals to the index followed by Constance Brown who improved the RSI with the concept of bull and bear market ranges. To this day, it remains one of the best technical indicators available to traders.
As a momentum oscillator, it measures the speed and change of price movements in an instrument's price. The index oscillates between 0 and 100.
According to Wilder, when the index is more than 70, the relative strength index (RSI) is overbought. When the index is less than 30, the RSI is oversold. When the RSI's highs and lows move in conjunction with the price trend, a convergence exists. This means the trend is likely not short-term.
RSI is one of the most frequently used momentum indicators by traders due to its simplicity and various advantages.
In addition to helping traders recognize overbought and oversold securities, it also provides information on the asset's past movements.
This indicator excels at offering signals for day traders to buy when the security is oversold and to sell when the security is overbought. RSI can also inform traders of whether the current price trends are long-lasting or not.
CLICK HERE TO READ MORE ABOUT RELATIVE STRENGTH INDEX
3. Simple Moving Average (SMA)
The simple moving average (SMA) is a core technical indicator used by many traders. Simply put, it is the average price of a security over a specific period of time.
It is the easiest and most customizable out of all the moving averages to calculate. To calculate the simple moving average (SMA), add the prices of an asset, typically, the closing price, in a specific range and divide it by the number of total periods within that range. In most instances, the closing price is used in this calculation.
The simple moving average (SMA) can be useful in determining the price action of a possible investment during a specified period in the stock market. For this reason, it can be one of the most useful technical indicators for day traders.
The simple moving average (SMA) of a security can also reveal its trend direction. If the SMA is moving upwards, the trend is moving upwards as well. Similarly, if the SMA is moving downwards, the trend is weakening. SMA can also be used to identify support and resistance levels if it is calculated for a longer time period.
An SMA is one of the most effective trading indicators for determining the price action of an asset.
CLICK HERE TO READ MORE ABOUT SIMPLE MOVING
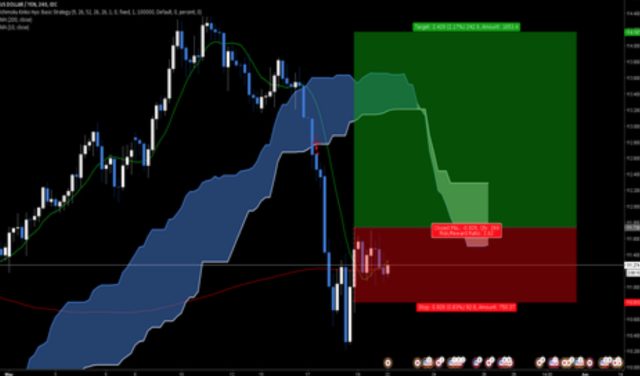
4. Exponential Moving Average (EMA)
The exponential moving average (EMA) is also known as the exponentially weighted moving average. Essentially, it is a type of moving average that applies more weight to more current data.
Since it relies more heavily on recent price data, EMA tends to be more reactive to recent price movements than a simple moving average (SMA).
Similar to other moving averages, traders can use exponential moving averages to identify trading signals based on any divergences or crossovers. EMA is particularly useful for recognizing overbought market or oversold market conditions. EMA can also be used to identify support and resistance levels, trend reversals, and more.
However, despite its merits, there are some disadvantages to relying solely on moving averages. Since these averages follow trends, they might lag behind other indicators. The trading signals also tend to appear later than other technical indicators. For this reason, it's best to use the exponential moving average (EMA) in conjunction with other trading indicators.
Most day traders prefer to use EMA to gauge trends, analyze performance history, and predict future prices.
CLICK HERE TO READ MORE ABOUT EXPONENTIAL MOVING AVERAGE
5. On-Balance Volume (OBV)
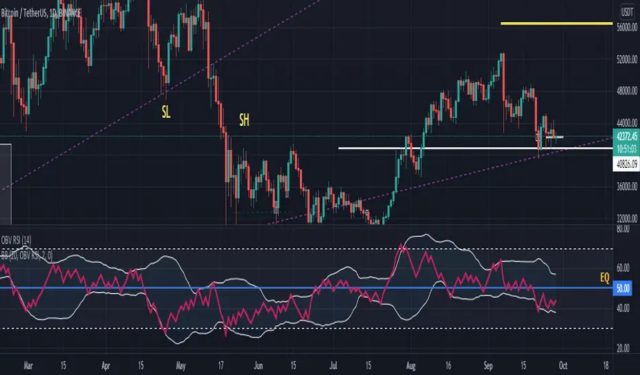
On-balance volume (OBC) is a technical volume indicator that predicts changes in the financial instrument's price using volume.
It was created by Joseph Granville in his 1963 book, Granville's New Key To Stock Market Profits. Granville, who was a financial writer and speaker, argued that volume is the driving force behind market prices. According to Granville, drastic changes in stock price usually follow a significant volume change.
Regardless of whether the indicator is positive or negative, traders can use this indicator to predict market prices. The flow of volume also reveals crowd sentiment, specifically the buying and selling pressure on a particular instrument.
OBV is frequently used by traders to predict an asset's price in the future. It can also be used to distinguish between institutional investors and retail investors whose market behaviours tend to be opposites.
OBV is an excellent indicator for recognizing potential market breakouts and breakdowns. By observing convergence and divergence, traders can predict whether the price will break resistance and play catch-up or whether the rally will slow down or reverse. This allows day traders to make better-informed decisions.
CLICK HERE TO READ MORE ABOUT ON-BALANCE VOLUME
6. Moving Average Convergence Divergence (MACD)
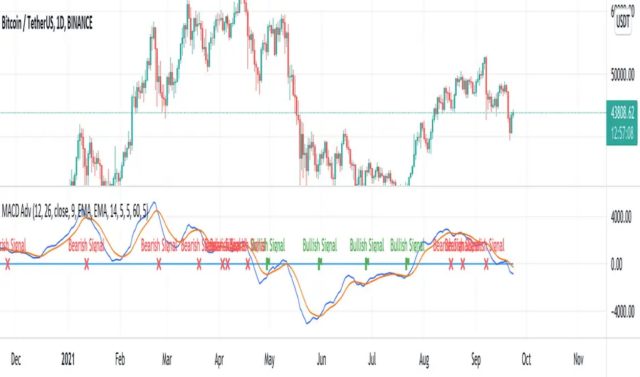
Moving average convergence divergence (MACD) is, simply put, a trend-following momentum indicator. It is a visual representation of the relationship between two moving averages of a security's price.
Developed in the late 1970s by Gerald Appel, the moving average convergence divergence (MACD) is one of the best volume indicators available to traders. Visually, it appears as two oscillating lines on a stock chart. The crossover that occurs between those lines provides traders with trading signals.
The MACD line lets traders visualize the convergence and divergence of the two moving averages. When the MACD crosses above the signal line, it signals for traders to buy. On the other hand, when the MACD crosses below the signal line, the indicator signals for traders to either sell or short the security. In addition to crossovers, investors can look for converges and divergences for potential trade signals.
The MACD line allows day traders to follow both trends and momentum. It also helps them understand the strength of bullish and bearish trends.
As a technical indicator, MACD stands out from others in its combined ability to function as a momentum and trend indicator. In combination with other technical indicators such as an RSI, it can provide a complete technical analysis of markets.
CLICK HERE TO READ MORE ABOUT MOVING AVERAGE CONVERGENCE DIVERGENCE
7. Bollinger Bands
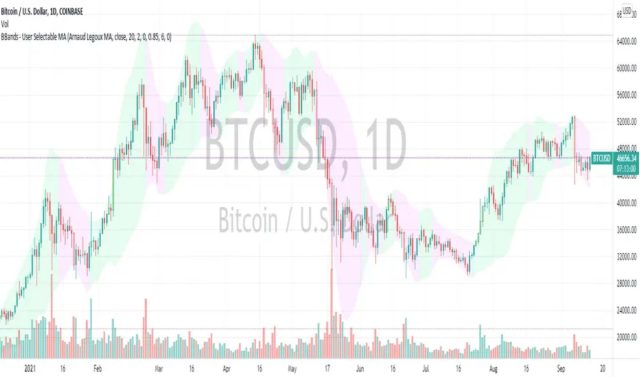
Bollinger Bands is an indicator that reveals price volatility over a specified time period.
Developed by John Bollinger in the 1980s, this indicator is a type of price envelope that conveniently combines much relevant information on a price chart.
Bollinger bands can help a trader determine if a current price is relatively high or low for an asset.
In addition to assisting day traders to recognize volatility in market prices, Bollinger bands can also help them identify profitable trading opportunities.
CLICK HERE TO READ MORE ABOUT BOLLINGER BANDS
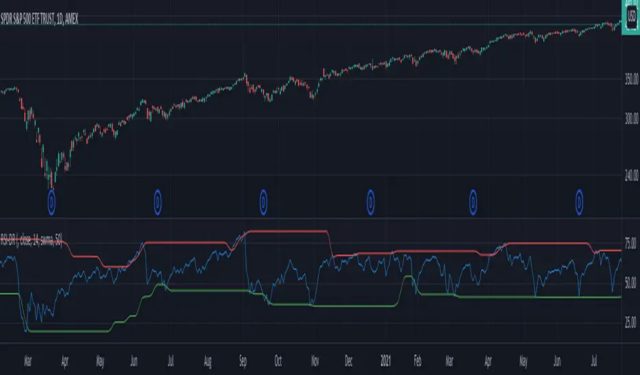
8. Average Directional Movement Index (ADX)
The average directional movement index (ADX) is a technical analysis indicator commonly used by traders to judge trend strength.
It was developed by J. Welles Wilder specifically in 1978 originally for commodity daily charts. Now, it's used by traders in numerous markets.
To measure the strength or weakness of a specific trend, the average directional index (ADX) uses two indicators: the positive directional indicator (+DI) and the negative directional indicator (-DI). These indicators display the robustness of a financial instrument and its price movement.
If the ADX is greater than 25, the trend in is strong. If the ADX is below 20, the trend is either weak or there is no trend in the price. A falling ADX suggests a decline in the trend. Meanwhile, a rising ADX shows a growing trend.
This is one of the most useful trend indicators available to traders. The manner in which price moves can help you decide whether to proceed with a long trade or a short trade. In addition, traders can use this information to identify trends with lower risk and greater profit potential.
CLICK HERE TO READ MORE ABOUT AVERAGE DIRECTIONAL MOVEMENT INDEX
9. Fibonacci Retracement
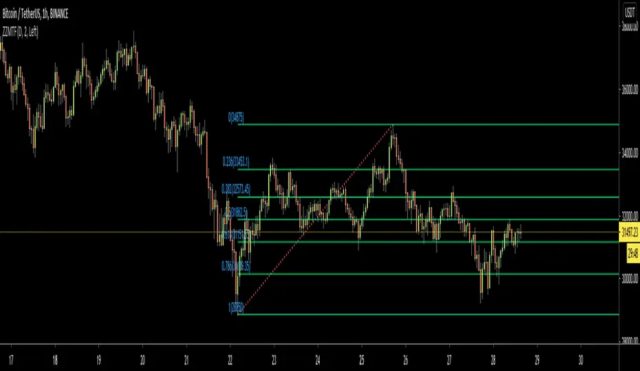
Fibonacci Retracement is a technical tool based on Fibonacci numbers.
Traders can use Fibonacci Retracement to predict the future prices of an asset. They can also help them spot potential support and resistance levels.
Furthermore, traders can rely on this tool to identify profitable transaction opportunities at a good price.
CLICK HERE TO READ MORE ABOUT FIBONACCI RETRACEMENT
10. Volume-Weighted Average Price (VWAP)
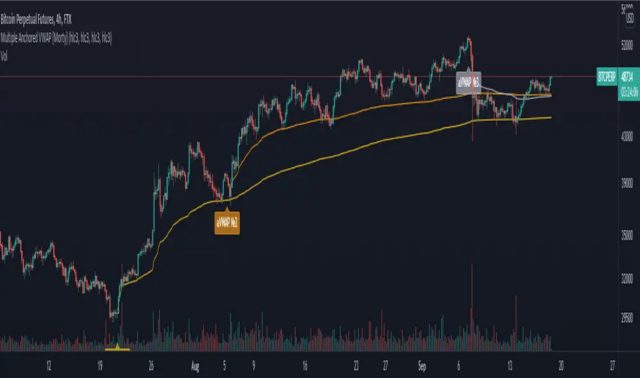
Volume-weighted average price (VWAP) is a key indicator used for day trading. It is the average price of a security weighted by volume. Simply put, it is the average price of a particular security was trading at throughout the day.
VWAP is calculated by dividing the dollar value for every transaction by the total trading volume for the day. Only trades that occur from the start to the end of the trading day are included in the calculation.
Since it only uses intraday market data, VWAP is an indicator used almost exclusively by retail and professional day traders. It can help traders recognize and confirm day trading trends. VWAP can also help inform their strategies.
Many traders use VWAP to determine whether to initiate a short or long position. When the price of a security is greater than the VWAP, most traders will choose a long position. On the other hand, when the price is less than the VWAP, traders will likely go for a short position.
CLICK HERE TO READ MORE ABOUT VOLUME-WEIGHTED AVERAGE PRICE
11. Stochastic Oscillator
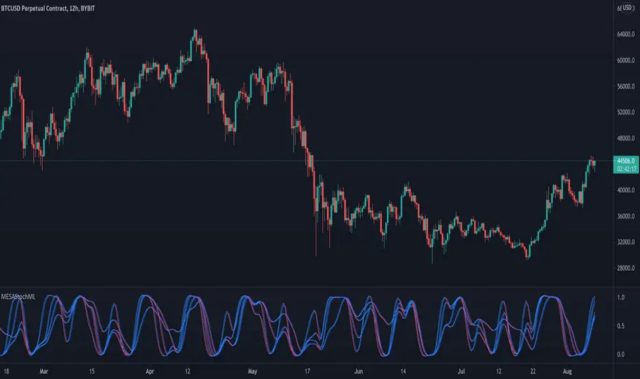
One of the most commonly used momentum indicators is the stochastic oscillator. As an indicator, it uses support and resistance levels for analysis.
Developed by George Lane in the late 1950s, this technical indicator studies the current price point in relation to the price range over a specified period of time.
A stochastic oscillator usually compares the closing price of an asset to its price range. This reveals an overbought or oversold position of a stock for traders to take advantage of.
Traders can use the stochastic oscillator to gauge momentum based on a security's history. It is one of the easiest and most accurate trading indicators for determining the best time to buy or sell a stock.
CLICK HERE TO READ MORE ABOUT STOCHASTIC OSCILLATOR
Best Resources For Traders
Traders who are looking for these indicators should consider trying the following platforms that offer their own robust versions along with other incredible analysis tools.
Simpler Trading

Simple Trading is a comprehensive trading platform that offers many of the technical indicators on this list and combines it with years of extensive trading experience.
Traders will benefit from the analysis tools and the expert advice of some of the industry's most successful professionals.
Any serious trader who wants to make a profit from day trading should try Simple Trading.
CLICK HERE TO READ MORE ABOUT SIMPLER TRADING
Benzinga

Benzinga is another excellent resource for trade analysis.
In addition to being the best platform for real-time market news, it also offers a ton of robust features. These features include a stock screener, chat room, real-time alerts, and so much more.
CLICK HERE TO READ MORE ABOUT BENZINGA
Motley Fool

Motley Fool is a stock advisor that does the hard work of analyzing the market for you.
They offer their subscribers access to their extensive research, educational resources, and of course, stock recommendations that consistently beat the market.
Individual traders who are overwhelmed with the various indicators and would rather leave the analysis to a professional should consider Motley Fool.
CLICK HERE TO READ MORE ABOUT BENZINGA MOTLEY FOOL
Conclusion
Traders who trade without these indicators are trading blind. A combination of technical and fundamental analyses is key to your success as a trader. It's important to take advantage of these indicators as a day trader to maximize your daily profits.
Although it might be tempting to add as many of these indicators on your technical analysis chart, it's best to select a couple that aligns with your objectives. Many inexperienced traders make the mistake of monitoring too many indicators which could be overwhelming and confusing.
Simple Trading makes this process easier by providing traders with the necessary tools to succeed coupled with expert advice and educational resources. If you want to learn how to properly use these indicators and succeed as a day trader, you ought to try Simple Trading.
F.A.Q.
How Do You Identify Buy And Sell Signals?
Many traders closely monitor trends in an attempt to find signals to buy and sell in the market. Many technical indicators are particularly useful in this regard.
While buy and sell signals may appear different depending on the market, a general rule is to closely watch for buy signals when the market is moving in a downward trajectory and watch for sell signals when the market is in an upward trajectory.
It's also important to watch how fast and how far price changes in markets. This can inform traders of the best time to buy, sell, or short securities. Ultimately, the length of time to hold on to the trade depends on the individual trader and their profit targets.
What Are The Best Indicators For Day Trading?
The most useful indicators for day trading are undoubtedly the ones that study analyze price action. When it comes to day trading, price action is everything.
Which Technical Indicators Are Best For Day Trading?
Ultimately, the best technical indicators depend on the day trader and their preferences. However, there are some indicators that tend to be more popular among day traders.
Moving averages, both SMA and EMA, are often used for intraday trading due to their simplicity and insight into price movement.
Bollinger bands are also very popular among intraday traders because of their ability to spot profitable trade opportunities.
The Squeeze Pro Indicator at Simpler Trading is another excellent choice because it automatically adapts to volatility and combines several indicators into one.

