
Want to jump straight to the answer? The best forex broker for traders is Avatrade
The #1 Forex Trading Course is Asia Forex Mentor
Bat Pattern – Quick Setup Tutorial
One way to trade successfully is using the Harmonic pattern. Harmonic pattern trading has a considerably high success rate among traders. On a backdrop, Harmonic patterns are geometrical shapes that price action traces. The harmonic price patterns derive its names from key Fibonacci ratios and Elliot wave movements.
The bat pattern is easy to trade, as it is with the crab and the Gartley pattern from among the harmonic patterns. However, for this post, we’ll zero down to the bat pattern. As part of pattern trading, noting a formation is not adequate. Instead, many aspects have to be in place for successful trading. In a nutshell, talk about the correct analysis, timing of trade entry, and every aspect of proper risk and money management techniques.
As part of efforts to conquer the markets, we’ll invite the expertise of Ezekiel Chew to share insightful basics on the bat patterns. Ezekiel is a Trader and lead trainer with Asia Forex Mentor. He gives back to society by sharing in-depth analysis of markets and speaking at global Forex events aside from training upcoming mentoring traders.
Far into the post, you’ll find the fine details of trading the bat harmonic pattern. And that includes long and short trades. Also, a section specifically for back-testing the bat pattern across their investment markets attempts to give a score for objectively trading the strategy.
What is Bat Pattern
The Bat pattern is among the most common of the Harmonic trading patterns.
Traders can have insightful analysis from the bat pattern, especially with the target highs and lows the prices form. Being part of the Harmonics, bat patterns have key Fibo ratios with probable price turning points.
It’s worth mentioning up front that harmonic trading patterns have one key characteristic – they attempt to make predictions of the future price movements. Quite experienced traders will notice that the bat patterns are almost similar to the Gartley pattern, save for the variations in the Fibonacci ratios applicable for each.
Also, one significant point regards the practical knowledge across the harmonic patterns – all require in-depth comprehension of Fibo ratios and the Elliot Waves theory in price action. Bat pattern formations are part of a corrective phase and ideally lead to wave 1 within the motive phase.
Of keen interest, traders should not mistake wave one in the bat pattern for the leading diagonal as in the Elliot waves.
The Bat harmonic pattern is an advanced formation in price charts that are quite sophisticated for a beginner trader. In that order, they may find it challenging. However, with the prior insight about the probable reversal zones, traders find the accuracy handy. Therefore, it's a great technical analysis tool every trader would strive to comprehend.
How to Trade the Bat Pattern?
Trading targeting to benefit from the bat pattern formation in price action has to bear in mind one significant aspect. It requires them to approach the analysis and trade set-ups with a good understanding of two concepts. One is the understanding of Fibo numbers and the use of the Fibonacci retracement tool. The Second one is clarity regarding the price action in light of the Elliott Wave’s theory.
In price action, bat patterns appear in two forms. One is the bullish bat pattern. A bullish bat pattern takes the resemblance of a letter “M” formation. Conversely, a bearish bat takes the opposite – taking a letter “W” like formation.
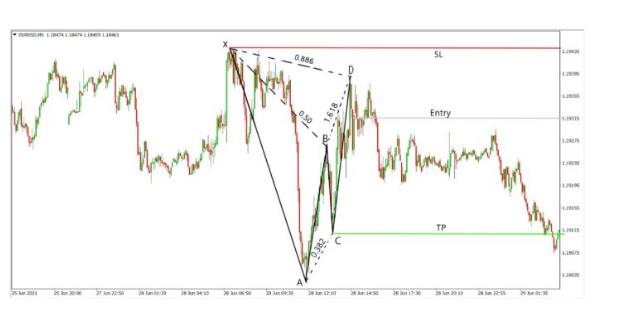
Technically, a trader requires to locate 5 points to qualify and trade the bat pattern. Each of the five points is designated with a specific alphabetical letter: X, A, B, C, and D. Each letter is a part of the Elliot wave movements. Prices follow the Elliot wave price action model, starting with the motive and the corrective phase. The letters CD designate the starting phases of a trend reversal.
The bullish bat pattern
A Bullish bat starts with an impulse wave from point XA. The impulse wave is usually a smaller degree, and it takes wave 5 of an Elliot wave. After the reversal, the prices settle back to point B – which is a retracement that falls between 38.2% to 50% of the move from point X to A (XA). The corrective wave (retracement and continuation pattern
) AB formation takes a larger degree.
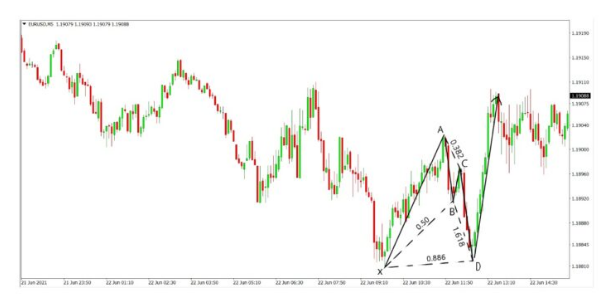
Next, prices target point C with a retracement of between 38.2% to 88.6% of the wave from point A to point B (AB). Therefore, BC forms the corrective wave from point C.
Lastly, prices drop further to the point D. The move to D is usually an estimate from between the 161.8% to 261.8% Fibo extensions in comparison to the impulse move AB. However, point D also falls within an 88.6% retracement from the impulse XA. Therefore, the move from C to D takes the corrective wave from point C.
Note: The Bullish Bat pattern takes a formation of the letter “M” if you observe it from a critical point of view.
The bearish bat pattern
Note: The Bearish bat pattern takes the opposite of a Bullish bat. As such, you’ll find it taking the letter “W” if you observe the formation from a critical eye – retracement and continuation pattern.
The bearish bat pattern starts with an impulse wave 5 of an Elliot Wave. From the image below, it's the move from point X to A or the move XA. It’s usually a smaller degree.
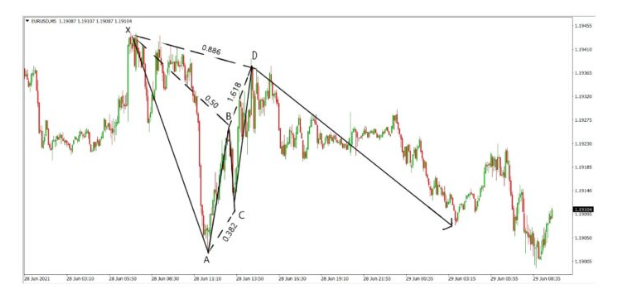
Next follows the move from A to point B – a retracement of the prices. And the retracement takes between 38.2% to 50% of the smaller degree move or impulse XA. Therefore, AB takes the corrective wave from point A with a larger degree.
Point C takes the retracement of between 38.2% to 88.6% of the move from point A to point B. So the move between B and C forms a corrective wave of B point retracement.
The last movement in prices settles at point D. And usually, it's a Fibo extension running from 161.8% to 261.8% extension of the move from point A to point B. However, it also falls within 88.6% of the retracement from the move between X and A. Therefore, CD forms a corrective wave of the move to point C.
Bat Pattern Structure Trading Rules
The best way to trade the Bat pattern builds on a clear upfront identification of the formation. And then follows the bit with correct timing of entry and exit. Of course, all the good trading rules apply: careful risking versus the rewards and in light of having taken adequate time to analyze price action with applicable indicators.
More emphasis on the identification of the pattern requires the distinction of whether the bat is bullish or bearish.
Set Rules for trading a Bullish Bat Pattern
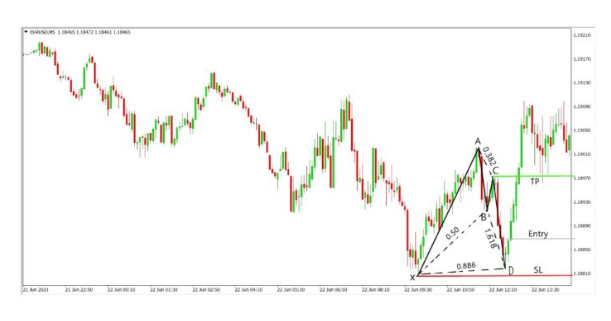
Trading the Bat bullish setup, the position of entry gets highlighted by careful observation of price action. The Stop loss positions are placed at point X, or in better words, the 100% retracement of the move from point X to A.
When it comes to taking profits, use the potential reversal zone. The target point for the bullish bat is at point C.
Set Rules for Bearish bat trade set ups
The trading rules for the bearish bat applicable are as those for the Bullish bat. However, the difference is the trajectory of falling prices.
Trade entries are made within the XA move (market swing wave movements). And the stop loss position is exactly at point X, or in other words, 100% retracement of the target price at position X.
Take profit positions are picked with point C as the target. The entry is determined by price action. The stop loss can be put at point X or the 100% retracement of XA. The profit-taking level can be taken at point C – the potential reversal zone.
Bat Pattern Pros and Cons
As applicable to every trading strategy, there are advantages and disadvantages. It’s, therefore, the duty of a diligently analytical trader to figure out the pros and use them to minimize the cons.
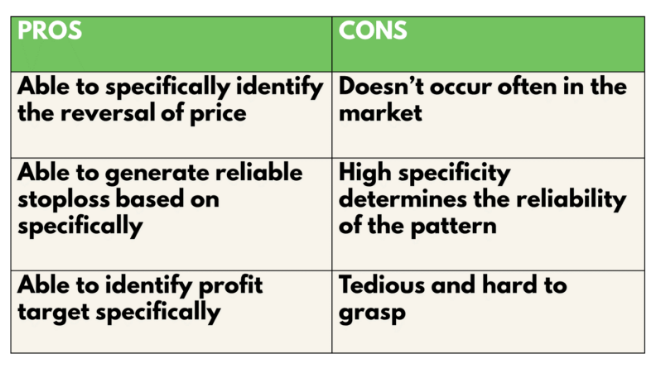
Here are the advantages of the Bat pattern:
First, the bat pattern is a highly accurate setup. And the setups arise due to the adherence to the key Fibonacci retracement and extension ratios. These help a keen trader to plot three key areas with high accuracy. And those are the areas of a potential reversal, stop loss positions, and target profit positions.
The bat pattern, however, is not a frequent occurrence in the markets. With that noted, traders need great patience and discipline while holding on. Note that at the same time, traders looking for the bat formation lose other chances. So there’s a huge opportunity cost with trading the bat pattern.
Further probing the bat pattern, in as much as it falls within the scopes of the Fibonacci ratios, there's no guarantee the setup will remain intact as always. And this is a key area where traders need to pay more attention. The degree of specificity plays a huge determinant in the reliability of trading the pattern.
False signals do arise, and part of the fallacy with the bat pattern may arise due to the incorrect ratios, both extensions, and retracements.
On the last note, the bat pattern is simple beginner traders unfriendly. We made mention of the pre-requisites. Bat pattern heavily relies on the knowledge and expertise of Fibonacci ratios and the Elliot Waves. Therefore, in shortage of both, traders find it a real struggle trading the bat pattern.
Analysis of the Harmonic Bat Pattern
strategy
In a bid to dig deep and find the evidence of how trading the Bat patterns acne be helpful to traders., this section will document backtest findings.
Therefore, in that order to backtest the bat pattern trading strategy, our back test picks on five trades running from 2 Jul 21 and taking the one minute (M1) timeframe. As for the rules of trade entry and exit, we’ll make reference to the section above- earlier in this post. Also, our backtests for variety will cascade three pillar markets with the entire financial markets.
Therefore, our three main assets and investment vehicles from the market are:
- EURUSD standing in for forex pairs,
- US30(DJI) standing in for the stock markets
- BTCUSD standing in for crypto-assets
And to help make things straightforward, we’ll take on the assumption that all trades are triggered with the risk taken amounting to 1% of trading capital per account.
Definitions of Key back test variables:
- The Average Risk to Reward Ratio is given by:
The Total Risk-Reward Ratio of all the winning trades, Divide by the Total Number of Wins
- Profitability of the Percentage is given by:
The number of the wins X The reward earned) Minus (The Number of Losses Made X 1) [ Risk is 1%]
The graphic below represents the application of the bat trading pattern strategy:
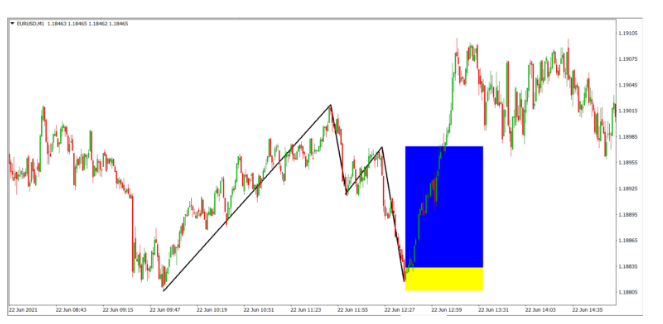
Notes to the Backtest results for harmonic bat pattern:
First, with reference to the image above, all trades within the regions taken are designated with yellow and blue shades for the overall wins.
Next, the yellow zones represent the trades with overall wins. And the blue shades represent the risks taken for the trades.
The results of the backtest for harmonic bat pattern
are as follows:
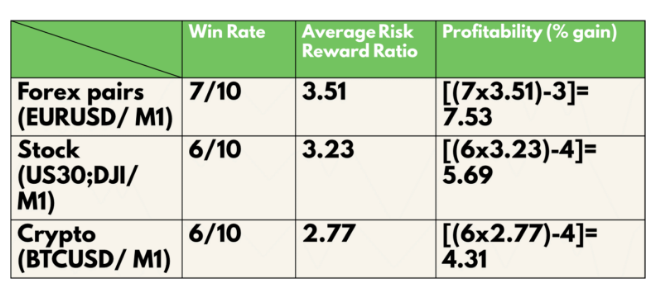
First is the Win Rate for Harmonic Trading:
- The win rate for EURUSD (Forex) is at 70%,
- The win rate for AAPL (Stocks) is at 60%
- The win rate for BTC (Crypto) is at 60%
Second is the average risk via a vis the reward ratio for the harmonic trading patterns system or bat pattern trading strategy:
- The average risk-reward ratio for EURUSD (Forex) score is 3.51,
- The average risk-reward ratio for US30 (Stocks) score is 3.23
- The average risk-reward ratio for BTCUSD (Crypto) score is 2.77
And lastly are the profitability scores of the strategy across the three markets:
- The profitability score for EURUSD (Forex) is 7.53,
- The profitability score for AAPL (Stocks) is 5.69
- The profitability score for BTCUSD (Crypto) is 4.31
Best Forex Trading Course

The best forex trading course is the One Core Program from Asia Forex Mentor. One Core Program helps you fast-track your expertise under the tutelage and mentorship of Ezekiel Chew. He brings in more than two decades of trading in the financial markets.
One Core Program helps traders from retail and institutional settings to lay hands on the treasurable rules of trading their way to six-figure profits after the little hassle of analyzing and understanding the markets in a correct and strategic way. Behind the scenes, Ezekiel trains on the optimal psychology to approach the markets. It builds on a proven mathematical model that uses probability to pick very few but winning trades.
May traders stop searching for the golden trading course with the top-rated – One Core Program. It builds knowledge holistically. Its approach caters to all traders from every walk of life and builds on catering for beginners to advanced traders.
The reason why One Core Program fits your trading needs arises from a simplistic approach. And it culminates with mentorship. Lastly, professional trading, according to the One Core Program, is nowhere near to bruising your eyes, glaring at charts for 20 plus hours per day. Find out more by onboarding the One Core Program.


Best Forex Brokers
Conclusion: Harmonic Bat Pattern
Strategy
The trading of the bat pattern strategy has higher profitability. It’s higher when you compare it to the Gartley pattern or crab patterns. Over and above the high win rates, of course, the bat pattern strategy is also more profitable.
While it’s easy to spot the bat pattern formation, it still fakes out traders. Therefore, the pattern’s formation is not a sure guarantee of profitability. The best way to go about avoiding the fake breaks with the bat pattern is to include more indicators to help refine entry positions with more specific metrics.
As we have made prior clarity, trading the bat pattern requires more expertise. More so, especially with the building of the Fibo tools – retracements and extensions, as well as the in-depth comprehension of the Elliot waves in trading. Therefore, the Bat pattern is not a good recommendation for traders who are on the brink of having started their trading journeys.
We encourage traders to approach trading the Bat pattern with a broader picture. And from the perspective of the broader picture, it includes the other harmonic patterns other than the Bat. There’s more opportunity with that form of perspective of variety.
Harmonic Bat Pattern FAQs
Is Bat Pattern Bullish?
To be very clear, the harmonic Bat pattern strategy is applicable in two forms. The first is the bullish bat structure or pattern, and the second is the bearish bat structure or pattern. Therefore, the bat pattern appears either in a bullish or a bearish form. Of course, the bullish one appears in the markets where prices are rising, while the bearish one appears in scenarios where prices are diving lower.
The approach applicable for profitable trading, to a major extent, relies on the identity of the formation with the contexts – bullish or bearish. Whichever context comes into a trading scenario, it’s best to approach it calmly with multiple authentications of price action. It’s the only foul-proof way to avoid fake breaks and losses.
How accurate is the Harmonic Bat Pattern Strategy?
The bat pattern is considerably accurate. And the accuracy comes up, especially when a trader is able to make verifications of the Fibo ratios and the Elliot wave movements. Agreeably, things happen in markets, and since a trader is not in control of everything, it’s best to always approach it with every risk measure put on the trading table.
Expert traders appreciate the accurate nature of the bat pattern when everything else is held constant. One downside, however, persists; it’s a rare pattern as regards its occurrence. As such, many traders chasing markets for it may lose heavily with opportunity costs. Therefore, it’s worthwhile to explore other patterns (gartley pattern)and better if they are more frequent in occurrence and higher in profitable setups.


