Want to jump straight to the answer? The best forex broker for traders is Avatrade
The #1 Forex Trading Course is Asia Forex Mentor
As a forex trader, one of the essential skills you should have is the ability to gauge the strength of a trend in the forex market, irrespective of its direction. Traders use many tools to identify and understand a trend. Most successful traders can use their knowledge of the trend to their advantage.
Many trading platforms use technical trend analysis to provide investment advice for their users. Some may even give a new user a risk-free demo account to help them understand the market. The belief among the majority of traders is that the best trading results are obtained from successfully identifying and following price trends in any financial market, including forex, stock exchange, options, bonds, cryptocurrencies, and so on.
The Average Directional Movement Index, also known as the ADX Indicator, is a technical indicator that is used to determine the strength of a trend. When it comes to evaluating the strength of a trend, the Average Directional Index (ADX) is a popular tool among traders. In this article, we’ve got Ezekiel Chew, a famous forex mentor, to share his take on the Average Directional Movement Index. As you read further, you will learn the history of the ADX, how to calculate it, and its limitations.
What is Average Directional Movement Index?
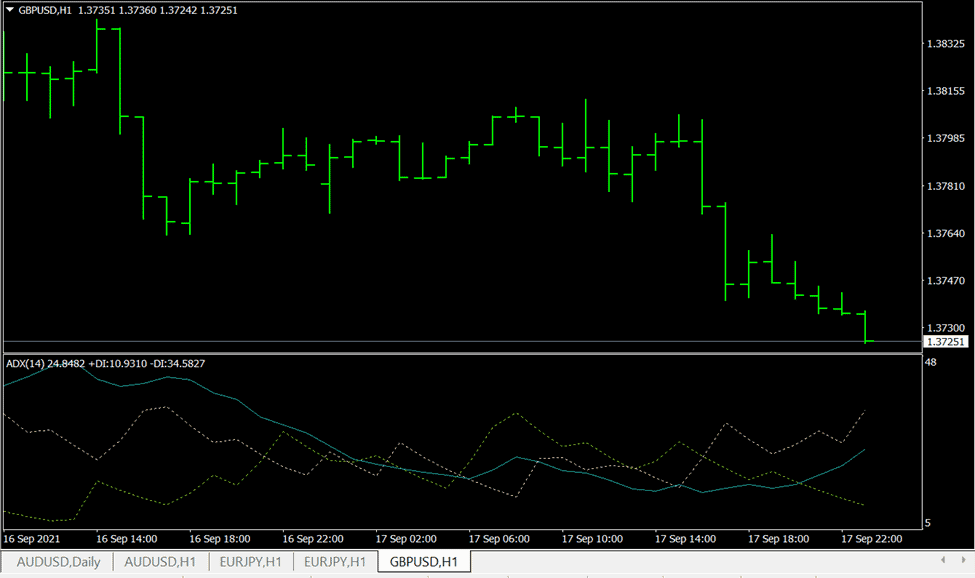
The Average Directional Movement Index (ADX or ADX Indicator for short) is a technical indicator that is used to gauge the strength of a trend. It is an example of an oscillator. The ADX measures trend within the ranges of 0 to 100. Readings above 50 typically indicate a strong trend, while readings below 20 indicate a weak trend. Sometimes, the market may be non-trending. A non-trending market does not always mean that the price is not moving. Instead, it may mean that the price is making a trend change or that it is too volatile to determine its direction.
It is essential to know that the ADX indicator does not tell you whether the trend is bullish or bearish. What it does is help you measure the strength of the current market trend. The Average Directional Index is a directional movement indicator that compares the highs and lows of bars but does not use the close of the bar. The intelligent trader uses their knowledge of the trend strength to determine whether to trade along with the trend or exit the trade. Knowing the current trend strength can also help you determine whether the market is ranging or starting a new trend.
The market trend can be up or down, illustrated by two indicators, the negative directional indicator (-DI) and the positive directional indicator (+DI). Whether a downtrend or uptrend, the ADX Indicator has a larger reading when the trend is stronger. It usually includes three lines (the –DI, +DI, and the trendline), which can help a trader determine whether a trade should be taken, and if taken, whether to be taken long or short.
History of Average Directional Movement Index
The Average Directional Index was introduced by J. Welles Wilder, a famous technical analyst, and market technician. Wilder developed this concept in his book, “New Concepts in Technical Trading Systems,” in 1978. Although the ADX Indicator was initially developed for the commodity and currency markets, it has proven to be just as effective in other financial markets. Technical traders use it to measure the strength of a trend.
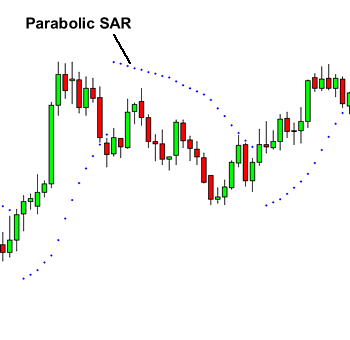
Wilder’s work has dramatically impacted modern trading and the understanding of the financial markets. He developed other widely appreciated technical indicators such as the Average True Range (ATR), Relative Strength Index (RSI), and the Parabolic SAR.
These momentum indicators form the basis of the technical analysis used by many technical analysts and trading software.
How to Calculate the Average Directional Movement Index
The Average Directional Index is calculated using a sequence of calculations due to three lines in the indicator. The following formulae can be used to calculate the Average Directional Index (ADX):
+DI = (Smoothed +DM/ATR) × 100
-DI = (Smoothed –DM/ATR) × 100
DX = ((+DI-(-DI)/ (+DI+-DI)) × 100
ADX = (Prior ADX × 13) + Current ADX)/14
For better understanding, here is a breakdown of the ADX calculation:
#1. The first step is calculating +DM, -DM, and the true range (TR) for each period. Fourteen periods are ideally used for the indicator calculation.
#2. +DM = current high value – previous high value
#3. -DM = previous low value – current low value
#4. Use +DM if the current high – previous high is greater than the previous low – current low. Use -DM if the previous low – current low is greater than the current high – previous high.
#5. True range is the greatest value between current high – current low, current high – previous close, or current low – previous close.
#6. To calculate the 14-period average values of +DM, -DM, and TR, you have to apply the -DM and +DM values and calculate to get the smoothed averages.
#7. First 14TR = sum of first 14TR values
#8. Next 14 TR value = first 14TR – (previous 14TR/14) + current TR.
#9. The next step is to divide the smoothed +DM value by the smoothed values of the TR to get +DI. Multiply the results by 100.
#10. Divide the smoothed -DM value by the smoothed True Range value to find the -DI. Multiply the results by 100.
#11. The (DMI) is +DI – -DI, divided by the sum of +DI+-DI with the result multiplied by 100.
#12. To get the ADX, continue to calculate for the subsequent 14 periods. Then, smoothen the results to get ADX.
#13. First ADX = sum of the 14 periods of DX / 14
#14. The following ADX = ((previous ADX * 13) + current DX) / 14
How to Read the Average Directional Movement Index
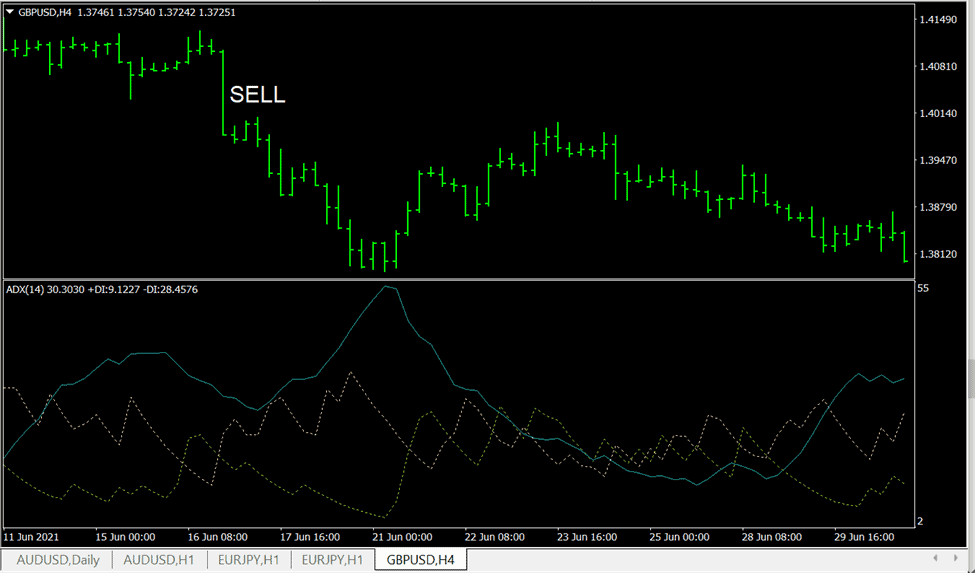
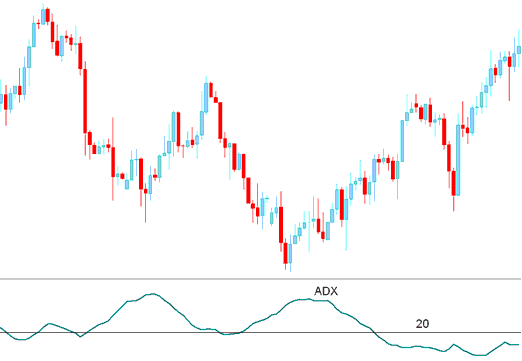
The ADX Indicator is a momentum indicator that helps traders assess how strongly the price is trending – whether its momentum is falling or rising. It is derived from both the negative directional indicator and the positive directional indicator, meaning that it measures only trend strength and not trend direction. The Average Directional Index (ADX) oscillator ranges between 0 and 100. Wilder suggests that a value above 25 is an indicator of a trending market, while a value of below 20 indicates little to no trend.
When the value is at 0, the price can move in either the negative or positive direction, meaning there is no overall market trend. A value of 0 may indicate that the price is not moving, that it is making a trend change, or in some cases, that it is too volatile for its direction to be determined. When it is at 100, it is moving exclusively in either the positive or negative direction, indicating a very strong trend.
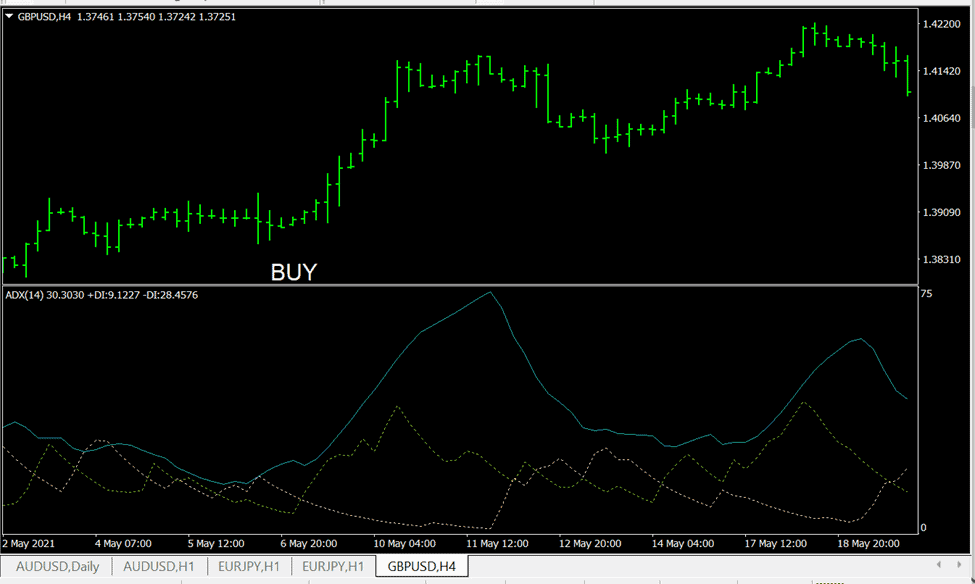
The ADX Indicator helps traders to be sure that they are trading in sync with current market trends. The trend strength is regarded as weak when the Average Directional Index value is between 20 – 0, and this may signal an impending reversal. When it is between 50 – 5, it is considered a strong trend, and when it is between 75 – 50, it is considered very strong. Values above this range are rare. When the value is upward of 75, it is an extremely strong trend.
A trend may be coming to an end when the ADX turns down from high values. Now is an excellent time to close any open positions you may have on the market. Also, you may want to trade the current trend if you notice that it has stayed below 20 for an extended period and then rises. The trend may be weakening when the ADX is declining, or the price may be becoming less directional. On the other hand, when the trend is rising, it indicates that it is strengthening.
How to Trade Divergence and Convergence Average Directional Movement Index
Traders can combine the moving average convergence and divergence with the ADX while trading. The divergence or convergence of the ADX Indicator is displayed on the chart in relation to the price at certain times. They can be valuable indicators in helping traders prepare trading strategies for a reversal. The convergence and divergence can also be used with other indicators such as the Parabolic SAR to take advantage of the market’s trend and maximize profit.
Limitations
The ADX Indicator has several shortfalls that make it unsuitable for use as a standalone indicator. Because it reacts to moving averages, it responds slowly to market changes. Relying solely on the ADX Indicator may mean you are not always getting the current market situation. Also, ADX is most useful when trading trending markets. It can be prone to false signals during a ranging market resulting from market volatility or changing trends.
For charts with a lower time frame, ADX may have a low success rate because it cannot detect a pattern. The indicator tends to perform better on charts with a longer time frame, as the signals tend to be stable for longer. On a lower time frame chart, ADX might prove helpful only to the extent of identifying entry points.
Best Forex Trading Course

If you are a trader looking to fast-track your journey into earning six-figure trades is a mathematically proven model with a very low risk-free profit approach, and your best forex course is the One Core Program.
The One Core Program is a course with a cumulative 20 years of trading markets by Ezekiel Chew from the Asia Forex Mentor brand. It’s the main course for retail traders, institutional traders, and other market participants is taken from the introduction to the advanced analytical trading strategy to approach the financial markets.
Lastly, the One Core Program builds on a holistic approach to trading – it’s the main reason many traders end their search for credible skills by taking the One Core Program. In a nutshell, it tackles the psychological approach to trading, beating the market through the thorough analysis of price action as part of a trading strategy. It also lays emphasis on picking a few expected trades with high odds of winning.


Best Forex Brokers
Conclusion: Average Directional Movement Index
It is vital to understand market trends to be able to trade successfully. With the Average Directional Indicator, you can get a good picture of the market trend. Although initially designed for commodity charts, it has proven over and over that it is an excellent indicator for any other financial market. One of its biggest strengths is that in analyzing the trend, it provides traders with an effective way to filter signals for a range or trend strategy by making sure that they are trading according to the market trend.
Nonetheless, the Average Directional Index (ADX) is a lagging indicator, and it can leave traders playing catchup because it reacts slowly to market changes. The ideal way to maximize indicators is to combine one or more of them while trading. Using ADX with a complementary indicator will make up for its weaknesses. However, it is essential to ensure you do not fall into indicator redundancy. Indicator redundancy happens when you use multiple indicators to measure a similar price element, for example, simultaneously using the ADX and Stochastic to gauge trend momentum. You can use other indicators to complement ADX, such as RSI, Parabolic SAR, and MACD.
Average Directional Movement Index FAQs
What is average directional movement index in mt4?
The ADX technical indicator, which measures average directional movement, aids in identifying price trends. Welles Wilder developed it and went into great depth about it in his book, “New principles in technical trading systems.”
The simplest trading strategy based on the system of directional movement calls for a comparison of the 14-period +DI and 14-period -DI direction indicators. One can accomplish this by adding the indicator charts on top of one another or by subtracting +DI from -DI. W. Wilder advises purchasing when +DI rises above -DI and selling when +DI falls below -DI.
How good is ADX indicator?
It can be challenging to predict whether a trend will last or not when trading. The ADX is an excellent indicator that can visually provide you with some guidance in such situations. This can then be utilized to either create a technical trading strategy or simply to improve an already-existing trading system.
The ADX is regarded as the best trend indicator by certain FX traders as well. As you may already be aware, the trend is frequently referred to as a forex trader's best friend. As a result, an indicator that can gauge trend strength is undoubtedly well-liked.


