
Want to jump straight to the answer? The best forex broker for traders is Avatrade
The #1 Forex Trading Course is Asia Forex Mentor
ATR is the short form for the Average True Range. ATR is among the technical analysis indicators that traders use to analyze volatility in price action and help make trading better. As an indicator, traders read the metrics it provides to see if they can make a trade on not. Therefore, ATR provides extra insight into whether there's low volatility or high volatility in the market. Volatility indicators and subsequent atr values help analyze markets deeper than price direction or price moves at any given timeframe in the markets.
And to help us through an in-depth analysis of Average True Range, we’ll walk through this post with the leading expertise of Ezekiel Chew of Asia Forex Mentor Brand. Aside from Leading trainers at AFM, Ezekiel Chew has over two decades of experience trading the markets. He speaks at global Forex events and specializes in Corporate forex training – whose scope extremely benefits retail investors.
Moving on through the post, you’ll get clear coverage of the rules applicable for ATR in trading strategies. Subsequently, Ezekiel will highlight an analysis of the advantages and disadvantages of ATR. Towards the end, you’ll get an objective to backtest of Average True Range trading strategy, with a graphical analysis of the test results.
Last but not least is to share the purpose of this post. ATR is a good indicator. However, do not trade a strategy with it singly. Take the concepts from this post, do more market analysis, and test other indicators to pick your winner trading strategy. Also, read through to see a few notes regarding the best forex course where you can understand this best, among many other practical and proven strategies.
What is ATR Indicator

The ATR or the average true range is among the technical analysis indicators put into the markets by J. Welles Wilder Jr. ATR is exclusively covered in the New Concepts in Technical Trading Systems. Wilder is famous for developing other indicators arising from his qualification as a market technician.
ATR targets to measure the volatility of an asset, currency, or stock. And the indicator decomposes two metrics concurrently and gives an absolute value. One is the range of prices and the second is the units in time. Since volatility is the cause of huge drawbacks for many traders, ATR is a key indicator to help them note the changes in markets in good times. In that line of thought, ATR is a good indicator to help place reasonable stops while trading trends or other patterns.
Some experts also believe in trading the ATR strategy on its own. Towards that, it’s the main reason we put in the efforts with a backtest to see the reliability of ATR and especially gauging it from the point of view of its perceived profitability.
In terms of practical usability, ATR measures volatility, and it's easy to use. However, traders have to be aware that the metric of volatility given by ATR is directionless. In other words, ATR will not tell you whether a market direction is trending upwards, downwards, or in a consolidative state.
The average true range ATR formula is not complex. Calculating ATR measures rely on historical data by picking on simple moving averages for the past 14 days. To obtain the true range the following applies: current high minus a current low. The absolute value picks from the asset's price as follows:
- The closing price of the current high minus the previous close (Current ATR)
- Current low minus previous close(prior ATR)
How to use Average True Range Indicator

The ATR indicator is a reflection of volatility with respect to the fluctuations of the average price of a security for a given trading time frame. Earlier we made a point that traders can trade ATR on its own. However, a good number of traders use it within a strategy to help them place more accurate stop-loss positions.
The rationale behind using ATR settings for placing Stop Loss positions arises from the need for capital protection. Traders require to lose as little as possible with stops, and therefore, the setting is not too wide and only allows minimal losses only whenever prices escape in the direction of the SL positions.
The ideal approach of setting SL position using ATR aims at avoiding dead cat Bounces – instances when prices escape from a trend briefly, only to resume the long time trend. The applicable rule of thumb is to set a stop-loss position in multiple values of the ATR. Most traders apply the ATR value multiple of 2 for SL positions.
Charting software allows traders to incorporate and customize ATR lines. This makes it readily accessible and with the option to tweak the colors and line styles, enhancing the analytical aspect ATR places at the disposal of traders. Over and above the technical application, a trader requires to incorporate ATR in a reliable trading strategy. That’s a way to ensure it plays part in helping bring in the analytical aspect it's being sorted for.
In terms of practical usability, ATR as a volatility monitor requires the sifting of information with greater care. That ensures that traders only make trades when volatility in the markets is slightly higher than it happens under ordinary circumstances.
Average True Range Indicator Trading Rules
In the markets, volatility keeps shifting. A market is either in low volatility or high volatility. And that alone presents traders with a challenge as to what they should pick as the benchmark. However, with careful observance, traders can easily pick the benchmark or median. For the purpose of this post, we pick on the EMA (Exponential Moving Average) 28 as the gauge for median volatility.
Therefore, we apply our trades whenever price lines cross the ATR-EMA. We open long or buy positions when the ATR crosses above EMA, and wait for a one candle closing confirmation. If it’s a pending order, set it at the high of the bullish candle within an up-trending market. Set the stop loss position at 2 times the values of the ATR.
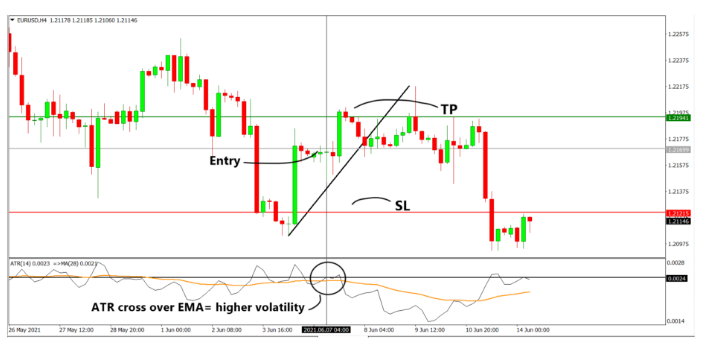
Follow that by setting a take profit at one (1) times the ATR value. The model will most probably give more wins since the profit targets are within ranges that price action will enable closures with profits.
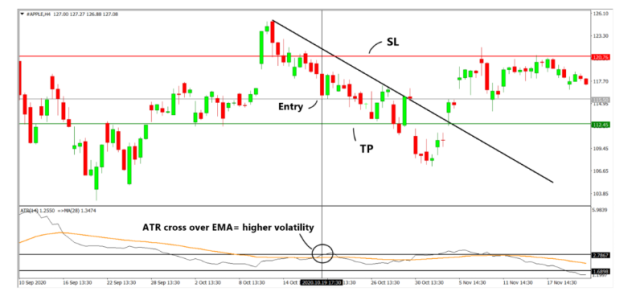
For Short or sell entries, allow for ATR to cross above the EMA line and allow for one candle closing. If doing pending orders, place the trade at the low of the one bearish candle in down trending markets. Set the SL at two times the ATR figure. And also, take the profits with a set of one (1) times the ATR figure or value.
As a note of advantage, using ATR to spot long and short opportunities makes it a great fit within many other trading strategies for traders. And it's one key reason why traders must take low risks (position sizing) to protect capital first. Many opportunities exist, and that should be a reason enough for traders never to trade riskily in a bid to make faster and bigger incomes.
Pros and Cons of Average True Range
ATR is beneficial for picking only trades within high volatility time frames. Beginner traders can onboard very fast and, at the same time, upscale their odds of making good trades with higher chances of winning. One other key pillar is the ability of ATR to help traders place precise stop-loss positions.
The ATR trading strategy works in a model that has higher certainty of hitting profit targets. And that arises from the reason that ATR takes the benchmark of average price movements while trading volatile markets.
One drawback with the ATR indicator is a total failure to provide precise signals. And that applies to both trade entry as well as trade exit. Therefore, a trader needs a special skill at analyzing price action to be extra effective with trades entry and exit. It’s in a scenario like this where traders require to work with another indicator.
Another drawback of the ATR trading strategy is the reliance on only one metric: price volatility. Traders require to work within the bigger picture that other critical metrics exit. ATR can therefore lead to biased trading when other metrics like volume and momentum are not in the picture.
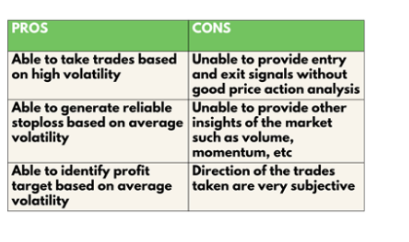
Lastly, a con with ATR is the failure to give insight into market directions – whether in low volatility or high volatility. We are aware that trending markets are a good opportunity for traders. While ATR shows no trend direction, it’s a bit difficult to trade on market sentiments alone. However, in our practical show of how best to work with ATR, we picked on trendlines. And trendlines never show a reversal signal like a parabolic SAR would – especially when it happens deftly.
Average True Range (ATR) Analysis
At this point, we’ll proceed with market backtests in a bid to come up with the documentation for the profitability trading of the ATR trading strategy. Our backtest sample will nil down to sets of 10 trades taken from 16 Jun 21. We’ll use the four-hour (H4) timeframes while using the entry rules as discussed earlier in this post.
To help pick variety in the markets, our backtest will involve 3 trading opportunities:
- EURUSD for forex pairs,
- AAPL for the stocks
- BTCUSD for cryptocurrencies
Each will take a 1% risk of capital in the trading account.
ATR Strategy Formula Definitions:
One is the Average Risk reward ratio:
Equal to [Total risk-reward ratio of winning trades divided by the Total number of Wins]
Profitability (Thai is Percentage Gain)
Equal to [Number of Wins Multiplied by the Reward] Less [Number of Losses X 1) [ Risking is @ 1%]
Here below is a graphical representation of the application of the ATR trading strategy:
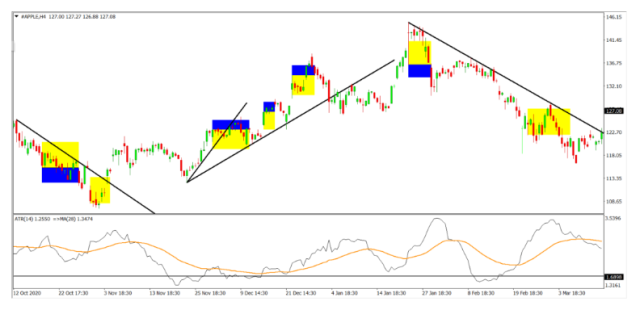
Legend: Trade taken are shown on areas with blue and yellow.
The areas in blue are the rewards taken, while the areas in yellow are the risks taken per trade.
Analysis of results shows the following outcomes.
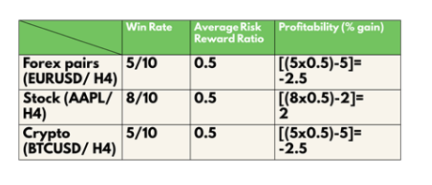
Win rates for backtests for Win rates:
- EURUSD (Forex) scores a 50%
- AAPL (Stocks) scores an 80%
- BTCUSD (Crypto) scores a 50%
The average risk-reward to ratio score is 0.5 for all three trade vehicles. The reason is that the trades were taken with each using multiple values of ATR.
Lastly are the profitability results.
- EURUSD Forex currency pair has a profitability of -2.5
- AAPL for Stocks has a profitability of 2
- BTCUSD, a Cryptocurrency, has a profitability of -2.5
Best Forex Trading Course

Turn around the fortunes of your trading career with the One Core Program, a trading course from Asia Forex mentor. One Core Program is built on the two-decade trading expertise of Ezekiel Chew – the Lead Mentor and trainer.
While Ezekiel is key in Corporate Forex training, the One Core Program is a package to help anyone willing to transform their trading careers for life. Through the package, He has trained institutional investors like the DTP bank, which is State-owned by the Philippine Government.
As a go-to Forex expert, Ezekiel speaks in notable Forex events, and his career trading forex is living proof that anyone with the correct approach has a huge opportunity at earning through Forex as a life career.
One Core program is a rare course within the Forex fraternity. From the initial tutorials, Ezekiel builds on trading confidence by making it clear that trading profitably is far more different than what new and losing traders take it to be. The One Core program lays emphasis on the low risk of capital. However, the course vaults you into increasing odds by taking on a Risk- free approach.
In this post, our focus is on the ATR indicator. But there are many ways to bag pips, and the only way you can grasp that is by taking the One Core Program. Let a mentor shape into your trading mind what will take you decades fumbling out for. Change your trading psychology and approach forever, and get to stick to the rules professional traders ride on to thrive where you fail.
Lastly, it is worth pointing out that through the One Core Program will help you build trading skills and discipline for life. It’s a course that builds your confidence, it skillfully shows you why you should not fear, and why you should not be greedy. And why you should not stop jobs, hobbies, and education, yet be a professional trader.


Best Forex Brokers
Conclusion: ATR Indicator
The average true range is a helpful technical analysis indicator for traders looking to monitor and analyze the volatility of a security. The ATR allows traders to take trades at certain levels of volatility but lacks at giving insights into the current trends – whether going up, down, or otherwise.
Following our backtests and aiming at using ATR to isolate trades of high volatility plus the realistic take profit points, the indicator scores unprofitably. And the main reason is that ATR misses on other key metrics that are as important while trading currency pairs, stocks, and crypto-assets.
Although, traders can refine the ATR strategy by further refining the variables, preciseness of taking profit, and stop-loss positions. Another leeway would be using several values of ATR indicators but with extra keenness.
Else, our recommendation is to limit ATR to scalping and also trading lower timeframes only. In that order, traders can protect their capital and grasp small profits while using a safe and non-excessive setting for Stop Loss positions.
Traders can also approach the ATR in a manner that whenever profit targets are hit, they can adjust stops to allow more breathing space. And if a trade stays in the course of their favor, profitability can be adjusted by widening the risk to rewards to allow locking of more profits.
ATR is a great tool to support traders across all timeframes. Traders can further alter, refine and add value to other trading strategies, especially those that clearly show market volumes and momentums.
ATR Indicator FAQs
How good is the ATR indicator?
One trading metric that ATR will very clearly bring out of the charts in the markets is volatility. Therefore, traders can take it as a reliable indicator for filling in the gaps in their trading strategies. How good ATR performs will also arise from a traders’ effort to see what works best for their trading decisions/scenarios and for specific financial assets.
ATR being an indicator without clarity of direction can, in some instances, mislead traders. The reason is market prices of financial assets have other key influential aspects that traders need to put into perspective while trading. A key focus here is on trading volumes and momentum, which ATR fails to distinguish.
How does an ATR indicator work
ATR is a unidirectional indicator. Meaning it shows the volatility of whether markets are trending upwards or downwards. At the core is how the ATR formula works, which picks on 14 periods of highs and lows to get the absolute true ranges. No benchmark is set, and it's therefore ideal to approach volatility with an applicable median like an EMA above 28 periods.
It’s straightforward for a trader to grasp and use in trading. However, for best results, ATR is best used among other indicators, especially those bringing into focus the metrics it misses. Things happen, and markets keep moving. It’s, therefore, reasonable to confine ATR to day trading and scalping strategies that work on short trading timeframes. An ideal model is a hybrid approach where, other than setting stops and take profits, other indicators can help monitor market reactions towards better trading.

