
Want to jump straight to the answer? The best forex broker for traders is Avatrade
The #1 Forex Trading Course is Asia Forex Mentor
A good understanding of technical indicators is crucial whether you are a seasoned trader or just starting your career as a forex trader. Indicators are mathematical calculations based on past prices and volume, and they can be used to help you predict future price movements. And one indicator that is gaining popularity amongst traders is the Aroon Indicator.
Aroon indicator is a momentum indicator that can be used to measure the strength of a trend. To better understand the Aroon indicators, we have got Ezekiel Chew, the CEO, and Founder of Asia Forex Mentor, to share his take on this indicator with us. His insights are highly valuable and sought after by many pro retailers. Also, Ezekiel is regularly invited to speak at many Forex trading events worldwide.
What is Aroon Indicator?
The Aroon is a financial indicator that determines whether a financial asset is trending, how strong the trend is, and whether it's heading in the right direction. The Aroon indicator was developed by Tushar Chande in 1995 (as well as other tools like the Momentum Oscillator or CMO). Since it means dawn's early light in Sanskrit, he chose the name “Aroon” for his indicator.
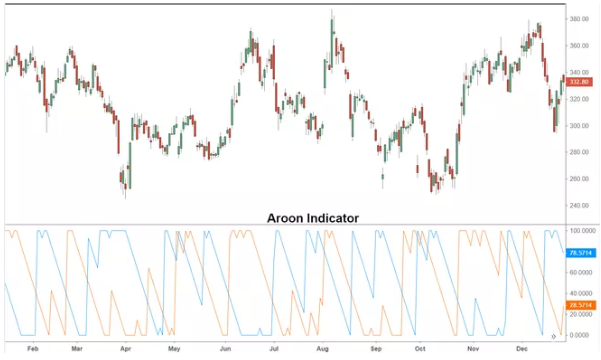
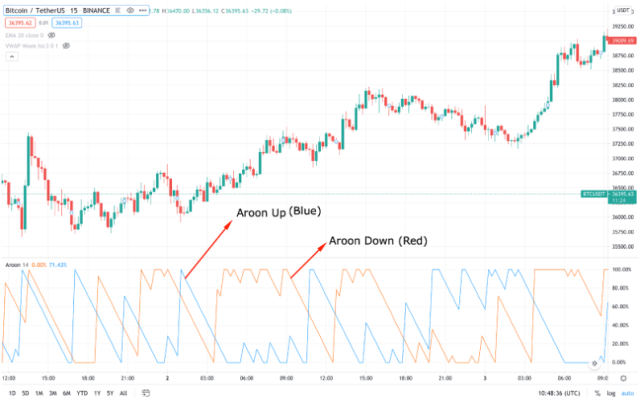
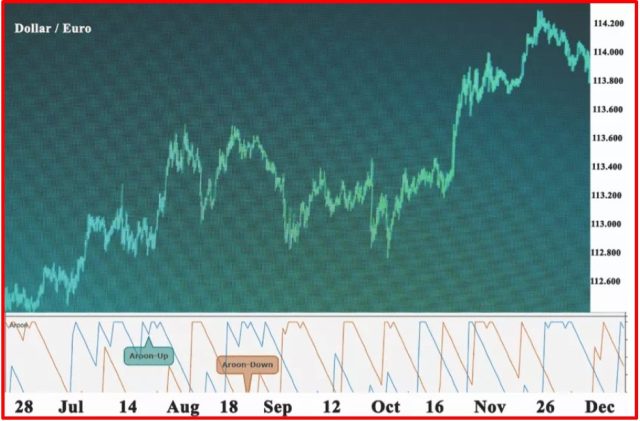
Aroon consists of two lines, the Aroon Up line and the Aroon Down line. These lines oscillate between 0 and 100, with 50 being the centerline. The Aroon Up line measures the number of bars since the highest high over a certain period. For example, if the Aroon Up line is at 70 on a daily chart, it has been 70 days since the stock made a new high.
The Aroon Down line measures the number of bars since the lowest low over a certain period. So, if the Aroon Down line is at 30 on a daily chart, it has been 30 days since the stock made a new low.
Aroon indicator system can be very useful to the trader as it will indicate whether a trend is weakening or strengthening. Therefore, if you know that a particular currency pair is in an uptrend, you will also understand that this uptrend is weakening if the Aroon indicator has crossed below its signal line and vice versa. In short, it helps traders measure the strength of trends and help determine the moment when to enter a trade.
How to use the Aroon Indicator
The Aroon indicator determines the time between highs and lows. The idea is that a powerful uptrend will show a new high, while a powerful downturn will reveal new lows.
The Aroon indicator is a popular technical indicator used in trading techniques owing to its ability to quickly generate large gains in the stock market. In addition, it's one of the unusual indicators that may assist traders in determining trends and having long-term success with their trading approach.
The price of an asset generally gravitates in a range, where it changes rapidly. As a result, the cost varies for a short period at any given moment during trading hours.
Aroon Indicator Formula
The Aroon Up or Down adjusts the duration from the previous high and low prices for the whole period. The values are presented as percentages, ranging from 0 to 100.
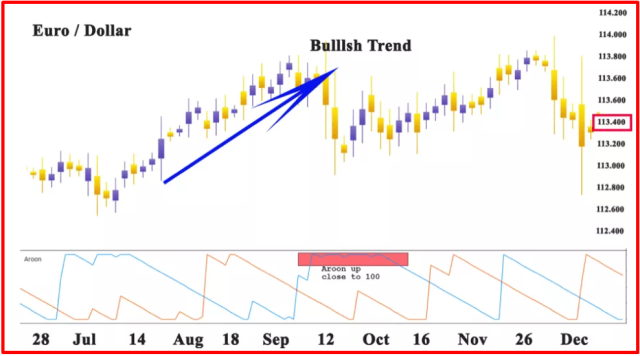
The closer to 100 percent, the stronger the trend. A strong uptrend is indicated by an Aroon Close around 90%. This can also be accomplished with a low Aroon Down Line to give us confidence in the trend. A low Aroon Down close to 100% indicates something hasn't been long ago.
Here is what the Aroon oscillator formula looks like:
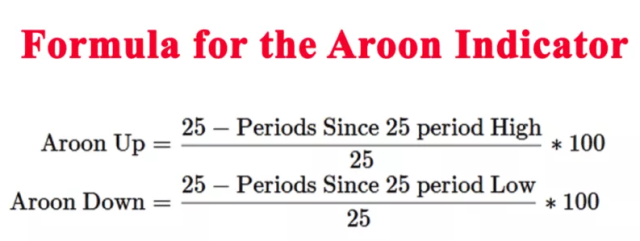
As a forex trader, if you want to calculate the present value of Aroon Up, you need to find the exact time when the stock price was at its highest in the past 20 days.
Let's say this was two days ago. Now that we have the Aroon Up, here's how to use the Aroon calculation equation to find out:
Aroon Up = (20 – 2) * 100/20 = 90
If the high had been 15 days ago, the value would be 25 now. So the higher the 20-day peak is to the present date, the greater Aroon Up's value is. This can be regarded as an upswing if there is also a low Aroon Down reading to confirm it.
Applying the Aroon Oscillator
One key factor that makes the Aroon indicator a popular technical indicator is its ability to indicate the strength of trends. The Aroon Up line can tell whether an uptrend is strong enough to overcome short-term resistance. And on the other hand, the Aroon Down Line can tell whether a downtrend is strong enough to overcome short-term support.
Many brokers and investors used the Aroon indicator to:
- Find new trends in the market
- Measure the trend strength
- Anticipate market reversals and identify consolidations
The basic interpretation of the Aroon readings represents that when the price of a stock is reading close to the 100 level, it indicates that the market is in a strong uptrend or downtrend. Conversely, a reading near 0 implies a weak bullish/bearish trend.
Interpreting the Oscillator
Three basic levels help explain the Aroon indicators i-e 0,50, and 100. The general meaning is that the market is bullish if Aroon-Up is greater than 50 and Aroon-Down is less than 50.
The price is trading within a rectangle, which indicates that new daily highs are more prevalent than new daily lows. This is not the case for a decline, as the Aroon-Down would need to be over 50 for a bearish signal to be valid.
Recognizing Consolidation
Two signs indicate that consolidation is emerging. The first scenario occurs when the Aroon-Up and Aroon-Down readings are below 50. The second situation occurs if the Aroon-Up and Aroon-Down readings drop in parallel. Consolidation is indicated when both measurements are beneath 50.
When the lines are parallel and combined, a trading range has formed. When the lines move in tandem, a trading range has developed.
Indicating A New Trend
After recognizing consolidation, it is important to be able to distinguish whether a new trend is forming or not. A new trend occurs in 3 different phases.
The first indication is when the Aroon-Up surpasses the Aroon-Down. These indications that new highs are more likely than new lows.
When the Aroon-Up goes over 50, and the Aroon-Down under 50, this is considered a bullish signal. The final sign occurs when the Aroon-Up reaches 100 and the Aroon-Down continues to be less than 30.
Aroon Indicator Limitations
While the Aroon indicator is quite useful when measuring trends, it has several limitations.
The disadvantage of the indicator is that, in turbulent market conditions, it provides weak trend signals. It may indicate a valid signal, but it is mostly too late to act. Nevertheless, when used with other technical indicators, the Aroon indicator is reliable in measuring the strength of a trend.
Another limitation is that it cannot be used to measure a stock's momentum. The Aroon indicator is a lagging indicator that doesn't predict future price movements. It only confirms the present trend.
Aroon Indicator vs. Directional Movement Index (DMI)
At first glance, the Aroon indicator appears identical to the Wilder-inspired Directional Movement Index (DMI). Both utilize up and down lines to show a trend's direction. The main difference is that the Aroon indicator formulations are concerned with the time passed between highs and lows. The DMI is based on the actual change in price between these points.
The DMI assesses the price difference between present highs/lows and prior highs/lows. The most important variable in the DMI is the time elapsed between these highs and lows. This is where the Aroon indicator diverges from the DMI, as the Aroon only looks at the number of periods since the last high or low.
The Aroon indicator is best used to identify a long-term trend, while the DMI is better for short-term trend detection.
Pros And Cons As Technical Indicators
There are several pros and cons to using the Aroon indicator as a technical analysis tool.
Pros
- Using the Aroon indicator helps you identify whether a trend is developing
- Aroon-Up and Aroon-Downlines can be used to identify trend changes
- The indicator is not complicated and easy to understand and use
- The traders can choose the timing of the Aroon Lines in any way they want
Cons
- Not effective in turbulent market conditions
- The indicator is lagging and based on historical prices
- Formed slowers as compared to the other trends
- It doesn't provide accurate results if used alone
- Price fluctuations are less influential than time changes
Best Forex Trading Course

Asia Forex Mentor is one of the most credible forex trading courses available today. It is headed by Ezekiel Chew, a trader making six figures per trade for over a decade. The trading methods are backed by mathematical probability and the trainer behind banks and trading institutions.
AFM PROPRIETARY ONE CORE PROGRAM is the core program that covers from beginner to advanced, and every segment must include the above points. The program is designed to make you confident and earn as quickly as possible in live markets.
It starts with the basics of forex trading and moves on to more advanced topics such as risk management, market analysis, and trade execution. The course also includes a live trading session where you can see the techniques being applied in real-time. If you're serious about learning forex trading, sign up now!


Best Forex Brokers
Conclusion: Aroon Indicator

The Aroon indicator is simple to understand and utilize in technical analysis, even for newbies just starting. It's good to put your trading strategies to the test with the indicator to grasp them properly.
However, remember that the Aroon indicator is a lagging indicator, which means it is based on historical prices and may not be effective in turbulent market conditions. However, it can be used to identify long-term trends and to help you make better trading decisions.
Aroon Indicator FAQs
Is Aroon Indicator Accurate?
The Aroon indicator is a lagging indicator based on historical prices and may not be effective in turbulent market conditions. However, it can be used to identify long-term trends and to follow stock prices.
What is Aroon Oscillator Indicator?
The Aroon indicator is a technical indicator that measures the difference between Aroon-Up and Aroon-Down. It is used to identify trend changes and gauge the current trend's strength. It is an extension of the Aroon indicator and helps to estimate the trend's strength.


