
Want to jump straight to the answer? The best forex broker for traders is Avatrade
The #1 Forex Trading Course is Asia Forex Mentor
The stock market is a popular investment hub amongst investors; studies show more than 71% of investors opt for a stock portfolio for investments above $1000. The regulation around the industry makes it safe for investors' precious assets. However, it doesn't mean that most investors succeed in uplifting their fortunes.
A related study showed that 68% of NYSE investors end with a lower portfolio value after 365 days of trading. It is mainly due to lack of education about the market that leads to poor decisions and terrible losses. It is essential for new investors to have a thorough understanding of the stock market before trading with real money.
Investors must be sure about market conditions before they step in; market trends determine investor sentiment; if the confidence is high, the market will have a rising trend, and it is an ideal situation to invest in an established company. Similarly, if the market is experiencing a falling trend, it isn't easy to make a profit by buying stocks.
Trend direction is essential in making the most of stock investments, but most investors aren't sure about the best trend analysis techniques. We can solve the problem by using the ADX indicator- it has been widely used to judge a trend's strength and base your investment decisions.
We have Ezekiel Chew with us to share his take on the subject. He is a world-renowned trading mentor and has helped thousands of students turn into full-time traders. His skills and knowledge have helped multiple financial institutions get better returns. Let's use his expertise for our benefit.
What is ADX Indicator
Every investor enters a market hoping to multiply their investments; there are two ways to do so. You can either buy a low-lying share and wait for it to rise or short a share at a high price and wait for it to fall. In either condition, you must have adequate knowledge about the market trend; otherwise, your decision will end in ruins. Most experts use ADX indicators and its subsidiaries to determine the trend direction and strength.
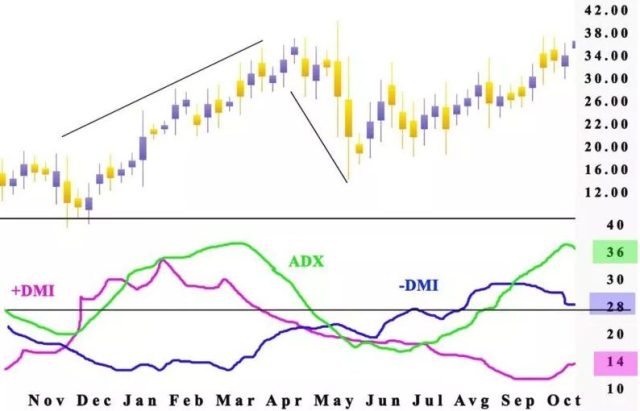
ADX, or average directional movement index, was created by Willes Wider in the 1970s; it uses complex calculations to determine the strength of a signal. It is used alongside negative directional indicator and positive directional indicator- the two indicators determine the asset's price movement. If the ADX value is higher than 25, the trend strength is appropriate to make a move; however, if it's lower than 20, the trend is weak, and you should abstain from making a decision instantly.
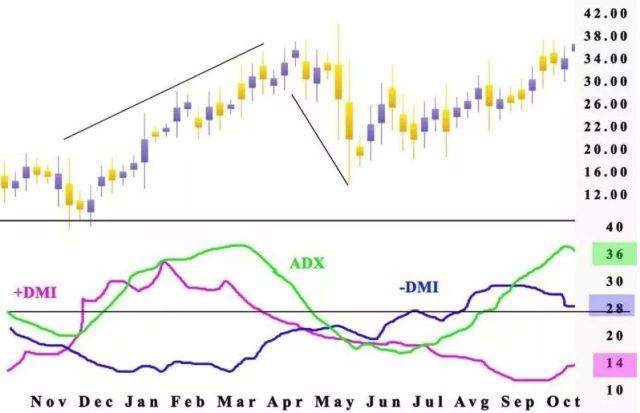
The directional indicators can also work as momentum indicators. If the negative DI crosses the positive DI with an Adx value of >25, it shows a declining trend, and the price movement is expected to be negative.
Similarly, if the positive DI crosses the negative directional indicator with a high trend strength, it indicates a positive investor sentiment and highlights a rising market trend. Some traders have a higher risk appetite and are willing to take a risk for quicker profits. Hence, they may opt for a lower setting of the average directional index-ADX, meaning they may set the trend strength benchmark at 20. Although the technique helps you pace your decisions and realize a trend early, it is prone to false signals. Crossovers aren't rare, and a trend reversal would mean your decision may go wrong.
Tactical Use of ADX
A strong trend can help you make a profitable trade in the long run; however, if you can't analyze the trend accurately, the same decision could go wrong. ADX is an intelligent indicator that puts you on track for possible profits. The directional movement system is a combination of the three indicators that were discussed previously.
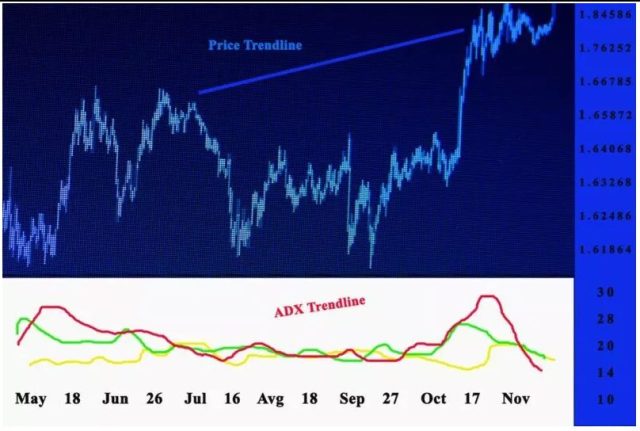
The three indicators complement each other, and you can't make a successful decision by using either alone. The price chart is the fundamental graph to base the three indicators; it highlights the changes in trends, and you can anticipate future trends by the first look.
However, breakouts are a common occurrence in a price chart; they refer to a rapid decline or rise in a share price due to external changes. Usually, the breakout doesn't turn into a trend, and the market creates an equivalent bounceback to keep up with the ongoing trend. On the contrary, there are some instances when a breakout forms the beginning of a new trend. The situation often confuses investors, and they are often perplexed regarding their decision during a breakout.
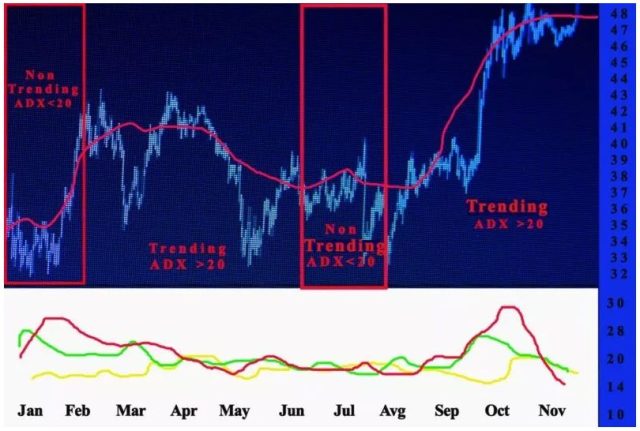
The ADX line is beneficial for determining a strong trend. If the Adx value stays under 20, it highlights a weak trend, and we can suppose a turnaround in a few days. However, if the ADX rises above 25, it signals a trend change, and you would need to make the change likewise.
At this point, you might think that ADX may cause you to miss profitable opportunities in a rebound or weak trend phase. It is partially true; ADX is a lagging indicator that uses previous information to determine future price movements. You can't use it as a sole indicator in your trading journey, and you must use moving average indicators alongside ADX for the best technical analysis.
Best ADX Trading Strategy
The best ADX trading strategy is based on the prevalent market conditions; it highlights whether to buy new stock or short your preferred securities. The first step is to use the ADX line and detect its level; if the value is below 20, you should wait for higher signal strength. Once the ADX value crosses 25, the next step is to see the position of directional indicators.
Suppose the negative DI line has crossed the positive DI, it shows a falling trend, and the price is expected to go down. The best strategy for a falling market is to short your trade; thus, when the market falls as per the trend, you'll profit from it. Similarly, if the positive DI line is above the negative DI line, the market is following a rising trend, and you should buy the security to benefit from future rises.
The last step is to wait until the trend strength goes below 20 again; it is the time to end the deal; you should get out of the trade and sell the securities at the ongoing price. The trading strategy can help you make the most profit from your investment. However, trading isn't as simple as we expect, and some additional tips should be used.
Firstly, you must use the ADX line for longer time frames to make decisions in short timeframes. You can use a 1-day timeline to dictate your intraday decisions. As ADX is a lagging indicator, shorter timeframes may provide confusing signals that may result in losses. Similarly, it is better to avoid trading with expectations of breaking news; they may result in rapid changes and delay some open trades.
ADX and Other Directional Movement Indicators
It isn't wise to over-rely on a single indicator, as it may have some deficiencies that shall cause losses for you. ADX must be used alongside other directional movement indicators to gain accurate insights into price data and make informed decisions. Expert traders often prefer using MACD and RSI with ADX for improved information about future markets.
MACD and ADX are a great combination; while the ADX line highlights the trend strength, the MACD curve shows the moving averages of different timeframes, which help you perceive future movements. It corrects the time lagging deficiency of the ADX indicator and helps you anticipate an upcoming trend before it is finalized.
RSI, or the relative strength index, highlights the strength of a stock based upon the changes in its prices; it has two benchmarks that provide insights regarding the demand and supply of the stock. The momentum indicator is often used to complement the findings of the ADX indicator; once a change in demand/supply occurs, the trader can use the ADX level to understand whether the change is temporary.
Trading isn't an easy game, and you must be sure about your information to make the right calls. It is better to begin trading with a risk-free demo account; it will help you practice in the real-time market with imaginary investments. Thus, you will learn the effectiveness of your strategies before putting your investments at stake.
Best Forex Trading Course

The stock market has numerous other indicators that traders use to get complete insights into the market. The ADX indicator has gained a positive reputation amongst traders, and they use it to detect a strengthening trend; however, you can never be sure about the efficacy of an indicator, and sometimes, even the perfect combination may give confusing results. In today's stock market, most companies suffer losses due to rising inflation and falling demand, which presents a less favorable situation to invest in.
The forex market presents a suitable alternative to multiply your investment at low risk. Due to the ease of entry, the market has seen various new entrants over the last few years. The new legislation ensures your investments are kept safe, and trading forex has never been easier. With the right course, you can start your forex journey and multiply your fortune.
Asia Forex Mentor is our choice. The course is a detailed take on the Forex world by Ezekiel Chew; it takes you through an elaborative five-step procedure to make fortunes in forex.
The course caters to the basic beginner questions but also includes information about complex advanced queries for expert traders. Hence, it provides an ultimate learning experience for all trading segments. The data is backed by mathematical probability; thus, all details are reliable and prepared to set you on the right foot.
Ezekiel Chew has been the man behind various financial institutions. His knowledge has helped traders achieve new highs in the forex world. The course is your chance to build the portfolio of your dreams.


Best Forex Brokers
Conclusion: ADX Indicator

ADX indicator has been a popular choice for traders for the past decade; it has helped them analyze trend strength and make profitable decisions. You can also use it to determine the market sentiment and the possibility of future profits.
An ADX level of more than 25 indicates a high trend strength, meaning the market is supposed to follow the ongoing trend. An ADX graph also has two other lines which represent directional indicators. The -DI line indicates minus directional movement, while the +DI line indicates positive movement.
If the latter is above the former, a rising trend is prevalent, and vice versa. Needless to say, no indicator is perfect, and there is always room for inaccuracy and confusion. An ADX line may sometimes give false signals during a breakthrough; thus, it is better to use a combination of multiple trend indicators to make the most profits.
ADX Indicator FAQs
Is ADX a Good Indicator?
ADX is a reliable indicator and has helped numerous traders achieve their trading dreams. However, you can't rely on a single indicator to put you on track for success. You must confirm the findings of one indicator by comparing them with others.
RSI and MACD are two complements for the average directional movement index. You can use them to overcome the delayed signal issue in ADX and understand the positional movement of a security.
What are the three lines in ADX?
An ADX graph has three lines, which represent the average directional index (ADX), positive directional indicator(+DI), and negative directional indicator(-DI). The ADX line is used to evaluate the strength of a trend- a value above 25 indicates high strength, and below 20 indicates a weak signal.
The -DI and +DI show the direction of the trend; if the -DI line is above the +DI line, it means a negative trend and vice versa.

