
Want to jump straight to the answer? The best forex broker for traders is Avatrade
The #1 Forex Trading Course is Asia Forex Mentor
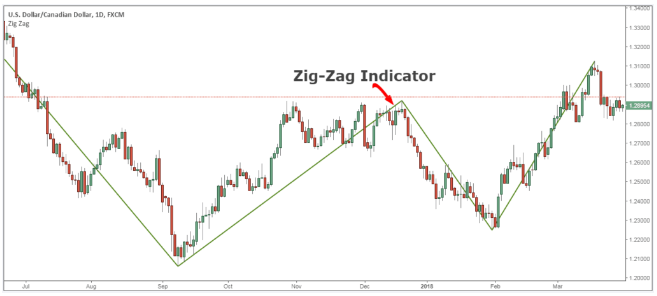
Investors use multiple trading platforms and want reliable data that is accurate and not corrupted. To ensure that the data is consistently accurate, different indicators are used. Some indicators can be found on different platforms, while others might be exclusive to a certain type of trading platform. The Zigzag indicator is one of those unique indicators that can only be found on the MetaTrader platform.
Zig Zag indicator is a tool used to filter the minimal fluctuations in the asset price trend. It also enables traders to follow the direction of the current forex market trend. It can also help traders predict future market movements and make better decisions when placing trades. The Zig Zag indicator is most commonly used to find resistance and support areas. It is often combined with Elliott Wave Theory to discover where different corrective waves are in a complete cycle.
To better understand the concept of the zig-zag indicator, we have got Ezekiel Chew– Asia’s Top Forex Trader & Trainer, to explain it in detail. Ezekiel is the CEO and founder of Asia Forex Mentor, one of Asia’s leading forex education companies. In this guide, we will discuss zig zag trading mechanics, its formula and calculations, different chart types, and more. So, let’s get started.
What is Zig Zag Trading
Zig Zag trading strategy is a type of technical analysis that uses support and resistance levels to identify market trend reversals. It is based on the idea that market prices zigzag between these levels, making small swings as they move up or down.
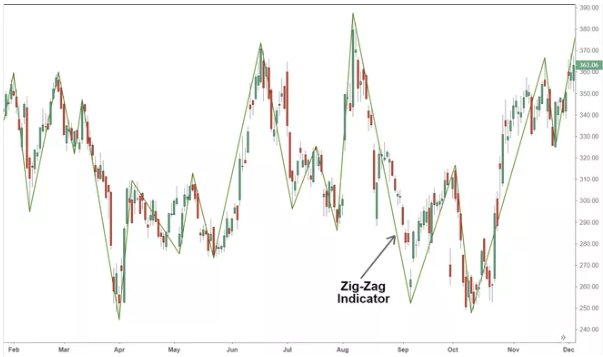
The Zig Zag tool is a relatively simple indicator that can be used to identify these reversals. It comprises a series of straight lines connecting highs and lows in the market price. These lines are known as “zigzag waves.”
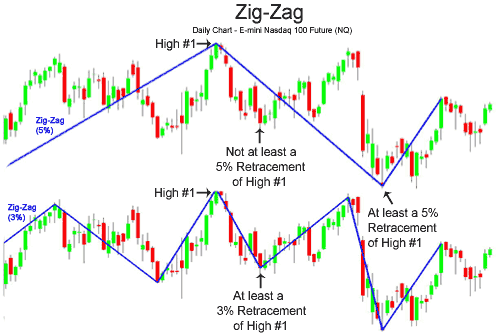
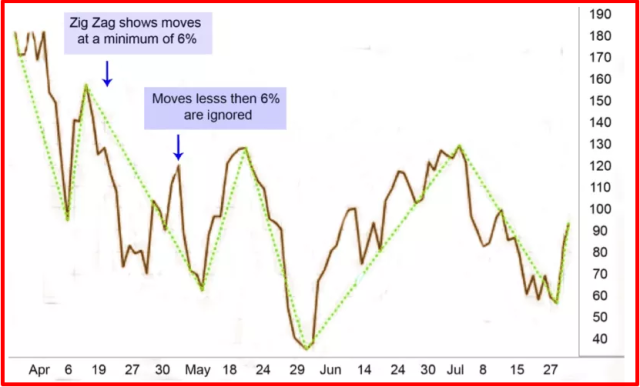
This indicator tracks the price trend and attempts to indicate significant changes in direction. Zig Zag lines just appear when a price movement between a swing high and a swing low is greater than 5%. The indicator eliminates random fluctuations and seeks to reveal market shifts by filtering tiny price changes.
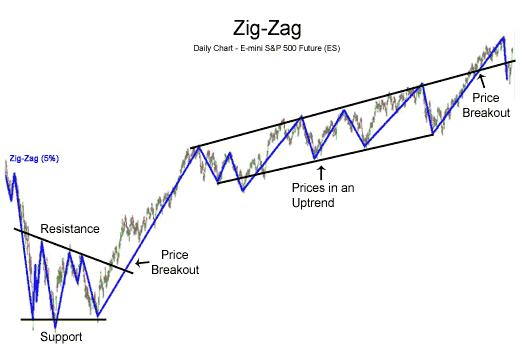
Traders often use the Zig Zag indicator to identify potential entry and exit points in the market. It can also confirm other technical indicators, such as trend lines or Fibonacci retracement levels.
Mechanics of the Zig Zag Trading Explained
The indicator is a simple analysis instrument that uses price charts to identify the lows and highs of the price. It functions by tracking whether a price has moved by a certain proportion after making a high or low and connecting the points with lines.
The Zigzag indicator is frequently utilized on price chart formations to determine a trend. The advantage of the indicator is its capability to remove a specific amount of volatility from markets while depicting trends with highs and lows. Moreover, investors and traders utilize turning points to form trend lines. However, the accuracy of the trend lines is contingent on the Zig Zag indicator’s settings.
With the Zigzag indicator, traders can get a clearer view of the market. In an upswing, prices climb to new heights and troughs. When a trend heads in a downward direction, on the other hand, the price creates smaller highs and lows. The reversal percentage is one of the Zig Zag indicator’s many settings. The standard 5% selection for the technical analysis tool joins the present high or low to the preceding high or low when the price reverses by five percent.
The indicator has a few applications, the most popular one being that it can help you understand Elliott’s wave theory. In addition, it can be used to show where the current price is in relation to the general cycle of the wave theory.
Investors can utilize the parameters to test strategies with the Zig Zag indicator, and changing fluctuations may show the indication framing the Zig Zag lines in a different way. Furthermore, it is also the best option if you need a technical instrument to locate resistance and support.
Formula of the Zig Zag Indicator
The formula of the zig zag indicator is as follows:
ZigZag(HL,%change=X,retrace=FALSE,
LastExtreme=TRUE)
If %change>=X,plot ZigZag
The values are represented as:
- HL: It equals a high-low price series or closing price
- %change: The series percentage change is the smallest possible price movement that can be expressed as a percent
- Retrace: A retracement is when the price of an asset reverses and moves back in the direction it originally came from. An absolute change is when the price of an asset changes from its highest point (trough) to its lowest point (peak)
- LastExtreme: If the extreme price is always the same for many periods, does it correspond to the first or last observation?
How to Calculate the Zig Zag Indicator
To calculate the Zig Zag formula, use the following steps:
- First of all, choose an initial point; it can be a low or high swing.
- After that, select a percentage price movement.
- Locate the swing highs or lows that differ from the initial points. It must equal the higher price movement percentage.
- Create a trend line from the initial to the new point.
- Locate the following swing, high or low, that differs from the new point that equals the larger percentage of the price movement.
- Now, form a new trend line.
- Repeat it to the most recent swing lows or highs.
Different Types of Charts – Zig Zag Indicators
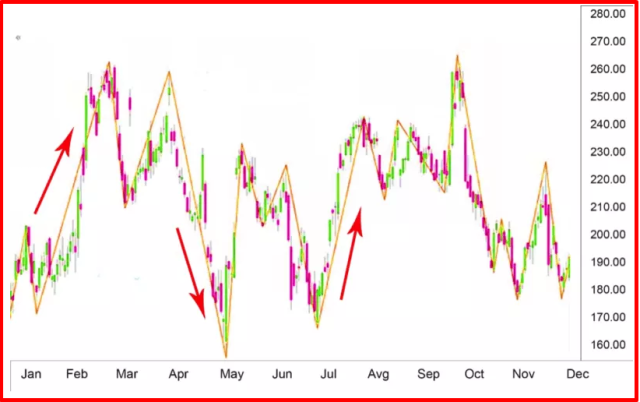
The Zig Zag indicator’s functionality depends on the chart type it is used on. It works with closing prices online or dots charts. When a candlestick pattern and bar chart is utilized, it responds to the entire price range.
If more fluctuations in the Zig Zag occur, additional trend lines will be drawn if bar or candlestick charts because they will display a wider range of values than those that just show closing prices.
How to Detect Price movement?
The ideal strategy is to use the Zig Zag when verifying a pullback and subsequent longer-term trend continuation. When the price drops in an uptrend before reversing, causing the Zigzag indicator becomes bullish.
This is a positive sign for investors interested in making long-term trades, and they should act now to buy and improve their position. By doing so, they can continually reap the benefits of profits.
It’s a very clear indicator based on a simple design. The Zigzags stick to a basic technique, which makes analysis tools more complicated. Market analysis is simplified by concentrating on the proportion of change rather than the entire movement.
Zig Zag indicator is quite worthy, and investors can use it at any time. Shorter time frames are more volatile, while longer frames provide stability and are ideal for long-term investments. However, this indicator doesn’t create any signals by itself, and the long-term investors are the only ones who use the Zigzag for a trade signal.
Many traders use the crossover method on daily charts or higher time frames. Because the indicator was not originally designed for that sort of trading, the performance is reduced when applied to short-term charts.
Zig Zag Indicator limitations
A moving average can also predict a price trend by looking at previous price history. Signals to buy and sell are generated based on past price history, just like other trend-following indicators. There are no certainties that may forecast future price movement. In most situations, the trend will develop, and the Zig Zag line will show up afterward.
Traders should be warned that the recent Zig Zag line, which was just shown, may vanish shortly if the procedure shifts in a new direction.
In this scenario, the indicator starts forming a new line.
When the line cannot contact the indicator set, and there is a drop in the asset price, it is detached and replaced with an extended Zig Zag line in the trend’s early direction. The Zig Zag indicator is useless for optimum timing entry or exit as it is a lagging indicator.
The Zigzag indicator is best utilized as a confirming tool. When line breakouts and candlestick patterns are used with the Zig Zag, it can provide precise entry and exit signals.
Furthermore, this indicator is not without its flaws. So, traders should be aware that more sophisticated technical analysis tools, like Fibonacci retracements, can be used to accurately time entries and exits.
Best Forex Trading Course

Ezekiel Chew is a professional forex trader and trainer. He is the founder of Asia Forex Mentor, one of the largest forex education companies in the world. He has 2 decades of experience in the forex market and is respected for his knowledge and expertise.
Ezekiel’s core program, ‘AFM PROPRIETARY ONE CORE PROGRAM,’ is the Complete Program, which covers everything from beginner to advanced. The program is designed to give you the best possible chance of success in the forex industry. It is backed by mathematical probability and has been used by banks and trading institutions for years.
Ezekiel is a highly credible figure in the forex industry. So, if you are trying to make money in forex trading, you should check out his program to start your forex career.


Best Forex Broker
Conclusion: Zig Zag Trading
Zig Zag is great for removing little short-term price fluctuations, allowing us to identify the significant ones more readily. It’s not wise to track different price trends that occur in the market; it would be a waste of your time and money.
Although it may appear that way, you don’t always have to sell or buy when the price changes. The most profitable investments will not experience large day-to-day differences. Still, with the ZigZag indicator, you can find when there are substantial shifts in highs and lows – these show moments where the price trend is changing directions.
We recommend using the Zigzag indicator and other stock analysis tools to get a more comprehensive perspective of an asset. The normal ups and downs (highs and lows) of financial markets are just part of spotting long-term patterns.
The Zig Zag is a lagging indicator because values are presented only when the close of every period. You can use it with other technical indicators to compensate for its shortcomings and take advantage of its capabilities. The Zig Zag indicator is effective for many trading strategies, including swing and momentum indicator trading.
The key is that the Zig Zag indicator has a specific purpose: it filters out small price movements so investors can remain focused on the overall trend. Always remember that price is the ultimate teacher when using the Zig Zag indicator. The Zig Zag attempts to smooth out price action but can never predict the future.
As a result, always use it with other technical indicators to identify potential market reversals.
Zig Zag Trading FAQs
Is Zig Zag Indicator profitable?
The Zig Zag indicator is not a standalone tool and should not be the only thing you consider when making trading decisions. However, it can be a helpful tool in confirming trade signals and identifying market trends.
How to read the Zig Zag Indicator?
The Zig Zag indicator allows investors to see the general movement of a security on a chart. For example, if the company’s ABS stock begins the month at $10 and then falls by 10% in value before increasing again by 10%, the total fluctuation is minimal, and the overall direction is upwards.

