
Want to jump straight to the answer? The best forex broker for traders is Avatrade
The #1 Forex Trading Course is Asia Forex Mentor
Volatility in markets is one aspect that investors and traders follow very closely. While new traders view volatility from the point of fear, expert traders plan to ride on the opportunities it brings.
Volatility raises the issues around market risks. And to help us understand the relationships, this is an exclusive post on how you can learn to trade with volatility indicators.
In order to share credible and practically helpful information, we’ve approached this from the point of view of an expert.
Ezekiel Chew from Asia Forex Mentor will be our guest expert on this. He is a trainer in Forex circles. He also sits in panels with global followership, discussing matters on market performance – where he gives insights that are highly sought after by traders looking to improve their skills.
Other than helping clarify matters around volatility indicators, this post will actually share out the most common indicators. For each mentioned Volatility indicator, Ezekiel will share its use cases, plus the pros and cons that come with each.
Towards the end, before the conclusion is a very useful tip on how traders can bring indicators of market volatility by blending them with their trading strategies. And finally, will be an FAQ section, where Ezekiel will respond to questions elicited by the information from this post.
What is the Volatility Indicator?
A volatility indicator helps traders to get a perception of the level of volatility in a market. Therefore, in that order, it is important to step back and shed more light on volatility itself.
Volatility within the stock and forex markets is a statistical measure. And it is primarily a measure of dispersion – meaning it gives a score of how far the prices of a stock or currency pair are from the averages.
Mostly, the higher the volatility scores, the higher the risks of trading the underlying asset or currency pair.
As regards the practical approaches, the capture of volatility measurements mostly appears in two forms—either the standard deviations or the variance. More so, the mean values of the price can be a benchmark from the same currency pair or security or from a relative asset’s prices.
In stocks, currency, and CFDs markets, volatility often arises with very drastic swings in the prices. And the swings can go in either direction.
In terms of documenting volatility, whenever the prices fall or climb within a range of more than one percent – with respect to a relative period, that’s a volatile market. In other circles, the volatilities of assets play a key role in the prices attached to options contracts.
How to Identify the Market Volatility?
Volatility indicators help market analysts to identify whether markets are in states of either high or low volatility. Also, the market analysts are able to spot setups where they can enter or exit the markets.
Large volatility usually creates a key obstacle for traders and their capital. It sends spells of huge doubt when traders are caught up in fear or losing trades. However, for market experts, high volatility is viewed as an opportunity to rake in profits within a short span of time.
The other way around, periods of low volatility present spells of market calmness where price action is more predictable.
Among the commonly used indicators for volatility to help with the estimation of volatility include:
- ATR or the Average True range
- VIX or
- The Cboe Volatility Index
- Keltner Channels
- Bollinger Bands
Traders should pull in efforts to grasp the workarounds with specific volatility indicators. With good skills in analyzing price action, traders are able to filter probable setups to enter and exit markets with profits.
On most occasions, volatility is driven by impacts caused by the news as they are released across the markets.
The Average True Range ATR Explained
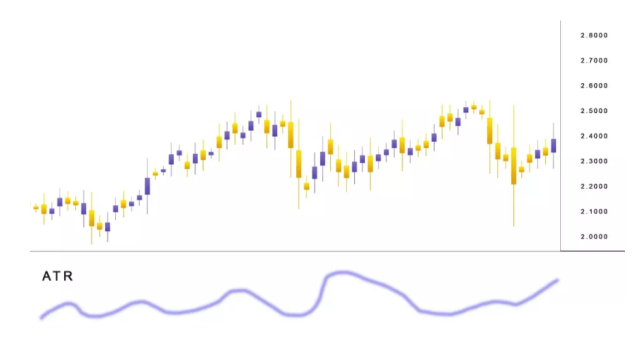
The Average True Range ATR is a common volatility indicator in the markets. However, ATR does not help with trend identification.
In reality, price volatility happens within sideways or choppy markets. Sideways markets are also a common feature once high-impact news hits the markets – while buries and sellers are not sure which direction to take.
One key thing with the ATR is the ease with which new traders are able to master how the indicator works. In fact, with good effort, they are able to incorporate it as part of their strategies.
And the key point here is to master how to enter positions relative to the score in volatility at any moment in the markets. And more specifically, spotting the correct zones to enter markets with reasonable stop loss and take profit positions.
How to Calculate the Average True Range ATR?
ATR calculations normally take three key steps:
- First, it starts with prices of the current day. The lowest price hit within the day is deducted from the highest price hit within the day
- Secondly, the close price for the previous day is deducted from the current day high
- Thirdly, using the present-day low, deduct the previous day's low
In the end, you’ll end up with three separate figures.
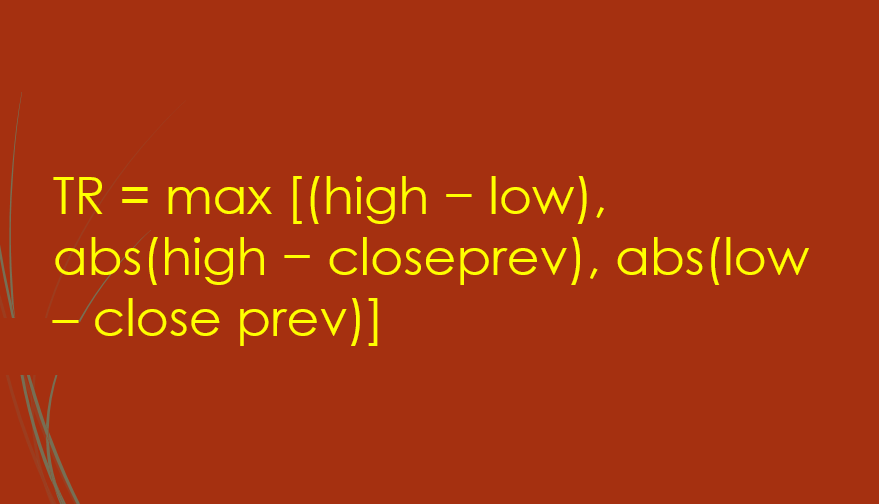
Here is a formula representing the entire three figures above:
TR = max [(high − low), abs(high − closeprev), abs(low – close prev)]
One significant fact to bear in mind while working around the ATR, it is a lagging indicator.
And the downside of lagging is the time it takes for the indicators to show changes in metrics like volatility and trends.
The best way to plug into the gap is working with a leading indicator – which gives signals way ahead of actual breakouts in prices. This works for traders who want quick opportunities to jump in and out of the markets profitably.
Back to the ATR, whenever it shows signals of high volatility, many traders may not have been well prepared to join. While in normal markets – the ATR will only show normal ranges without the sparks that drive markets.
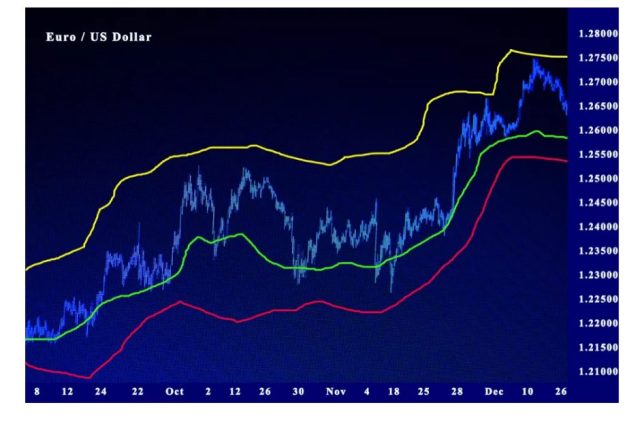
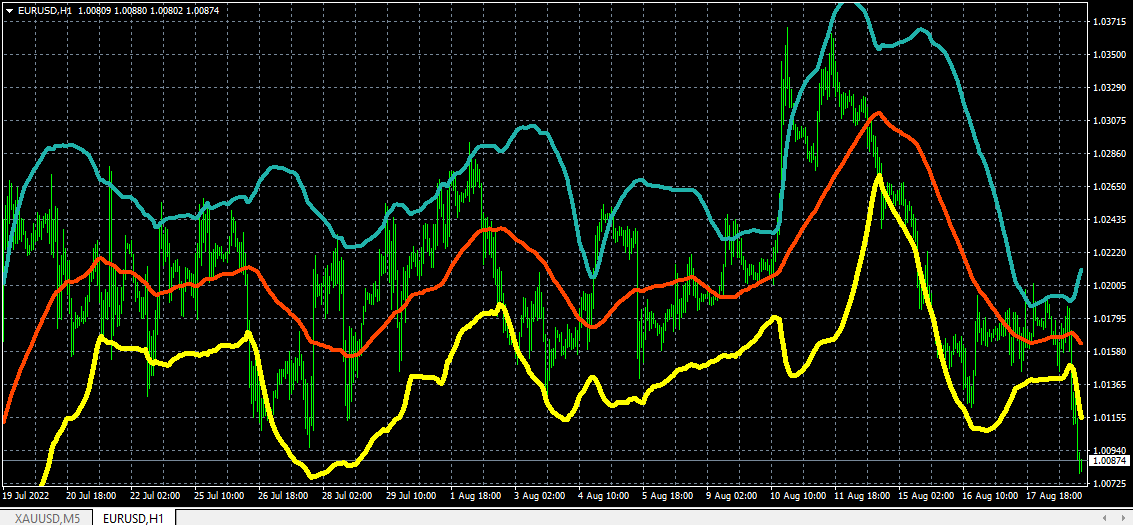
Keltner Channel Explained
The Keltner Channel shows bands with the price of an asset or forex currency pair showing as the average within it.
From the visual appearance, the Keltner channel is almost similar to Bollinger bands. However, in reality, it combines the characteristics of the ATR indicator plus the EMA or the Exponential Moving Average.
A Keltner channel actually follows a different method while identifying volatility. First, the Keltner channel uses a 20-day EMA or exponential moving average. Plus, the bands on either side take double the price- range of those Bollinger bands.
Market analysts have to be keen while making analysis to observe the variation of price within the extremes of the two bands. Any instances where the price comes into close contact with either of the bands signals potential breakouts arising from imminent volatility.
Advantages and Disadvantages of Keltner Channel

Keltner channels, as volatility indicators, have one huge problem – and it’s the slowness to point out the build-ups of volatility way ahead of price breakups. Other indicators are able to capture the build-ups and guide traders in the correct way.
However, if price volatility does not hit the bands on either side, it’s a display of slowing market action. So, it may not help much with traders who are risk takers – jumping into quick trades for profits with high volatile markets.
One key similarity with the Keltner channel with other indicators is the clear ability to point out whether markets are oversold or overbought. And this is helpful for traders approaching market analysis from the viewpoint of Moving averages.
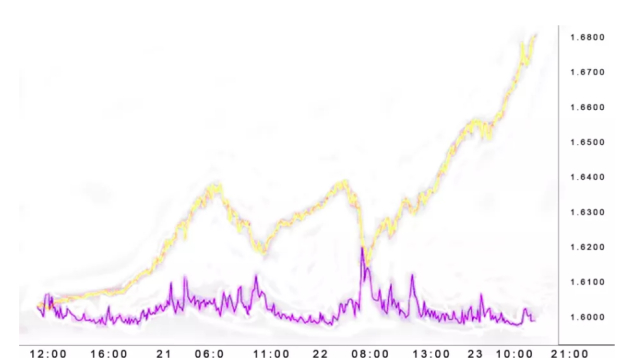
Donchian Channel Explained
The Donchian Channel is another volatility indicator, and it comprises three key lines. Each of the lines comes from calculations from MA’s or moving averages.
To be specific, there’s a median band that sits between the upper and lower band. And the space between the bands is referred to as the Donchian Channel.
Within specific periods, the upper band shows the highest prices. The lower band shows the lowest prices, and the specific period is usually within a month.
CBOE Volatility Index
VIX or CBOE index is the most common indicator of volatility in the markets.
The CBOE index derives from the data around options pricing models – typically showing the estimates of volatility per asset over time.
A good number of expert market analysts say VIX is very good at pointing out forested volatility or, in other terms, the present suggested volatility.
The readings, as shown by the VIX indicator, use key metrics to do with contracts of put or call ratios. Also, they put into focus the strike and expiry dates at any time.
Analysts should not work with guarantees from the VIX indicator but rather use it for short-term market assessments to their benefit.
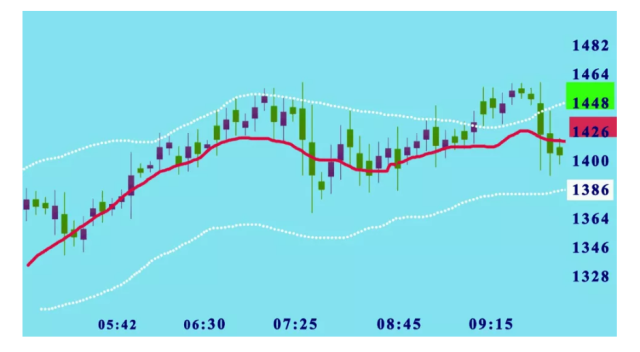
Bollinger Bands Explained
A good number of investors appreciate the preciseness of Bollinger bands in pointing out the market volatility of assets.
Bollinger bands use upper and lower bands to show increasing volatility with insights from moving averages.
Bollinger bands work best with other complementing indicators like the relative strength index. The combination helps to avoid losing money rapidly.
Wider bands show increased volatility – and the reverse holds. The narrow the upper and lower bands Bollinger gets, the volatility decreases and stands for quiet or uneventful trading.
Applying Volatility Indicator when Trading
In this post, we’ve gone through the insights on the most popular indicators of volatility. You can access them from most chart platforms.
A good mastery of analyzing each helps traders to note the transitions across markets – and, therefore, help perfect profitable strategies for trading CFDs.
It’s worth mentioning that highly volatile markets are equally or far more risky – huge chances to make losses.
While there are no perfect technical indicators in the markets – a good strategy helps perfect things and get wins instead of losses. One way is to avoid modulating indicators that sell at a fee promising high profits.
Best Forex Trading Course

Ezekiel Chew is a renowned forex trader, trainer, and industry expert. He has trained professional and retail forex traders as well as corporate finance players like bank traders, money managers, and asset investors. From his trading experience drawn from over 20 years of trading the forex markets, he has created a comprehensive forex trading course known as “the one core program”.
Ezekiel asserts that the one core program is designed for the ‘committed learner', so previous trading knowledge or experience is not required before you can enroll in the program. The program comprises over 60 video lessons that teach proprietary trading strategies that are backed by mathematical probability and technical analysis principles.
The one core program has been proven to be highly efficient as it has generated millions of US dollars for Ezekiel Chew and his students. There are numerous testimonials from students that have graduated from the program and are now making six-digit figures per trade just by applying the techniques learned from the program. The one core program is available on the Asia Forex Mentor website; which is a forex trading blog that has been existing for over a decade.


Best Forex Broker
Conclusion: Volatility Indicators

Volatility indicators help traders to gauge whether volatility is high or low. Traders have a choice of which markets they prefer, according to their strategies.
A few experts prefer highly volatile markets – and they have strategies to jump in and out of markets safely. Therefore, for them, volatility is a significant factor.
Most market prices react to high-impact news, and so volatility spikes up. Specific technical indicators can capture the build-ups of volatility and tally the same with their tried and tested strategies to make profits.
Volatility Indicators – FAQs
Is Volatility Indicator a Good Indicator?
Whether volatility is a good indicator depends on a trader and their strategies. Most newbie forex traders with retail investor accounts fear volatility, while some experts view it as an opportunity to make some very quick profits.
How do you measure Volatility?
Volatility in the market is measured with the help of indicators. It’s good to work with one that best fits your trading strategies.

