

Want to jump straight to the answer? The best forex broker for traders is Avatrade
The #1 Forex Trading Course is Asia Forex Mentor
Each candlestick pattern is distinct and conveys a different narrative about the state of a market. It's a terrific exercise to figure out what happens inside the market when a pattern like the tweezer top arises. Viewing and examining have a propensity to generate fresh trading concepts that, ideally, will develop into tradable and successful trading methods.
Forex traders use tweezers to analyze candlestick formations since they convey a lot of information about each trading period in an understandable visual style, enabling traders to examine the price trend in various time frames with a short glance at a price movement chart.
Any trader who wants to make a sustainable profit should deeply understand candlestick formations. With this, traders can conveniently place their market entry and exit positions, comprehend market circumstances, and prepare for risk assessment by performing a technical analysis of candlestick formations.
This article explores Ezekiel Chew's position on using tweezers top patterns in making a better trading decision.
What is Tweezer Top Pattern
The Tweezer top pattern is defined as a bearish reversal pattern. It occurs during an uptrend when buyers attempt to push prices higher but cannot do so, frequently ending the session near the session tops. It mainly comprises both bullish and bearish candlestick patterns.
A tweezer pattern typically appears while a trend is ending and essentially consists of two candlesticks or more, preferably a bullish and a bearish candlestick in any order.
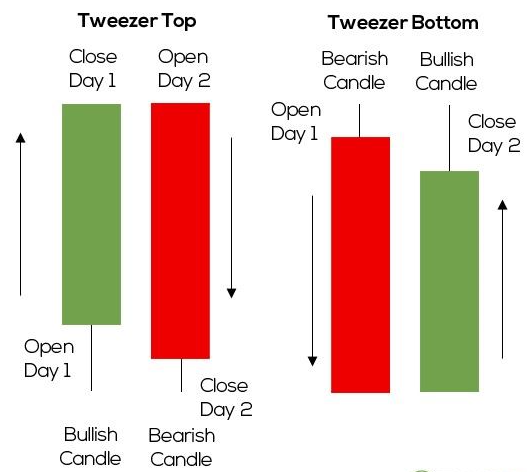
With the initial candle typically bullish and the next candle often being bearish, a tweezer top pattern is a candlestick pattern that appears near the end of a bullish trend.
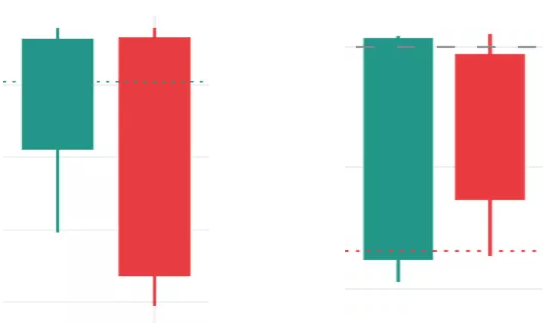
A tweezer top is a two-line pattern on price charts, meaning it is constructed of two candles on a candlestick chart that may be close together or separated by some candles. These two candles have similar highs at the top of the market, resembling the tweezer tool, hence the moniker “Tweezer Top,” which also refers to the high prices.
The two candles' higher wicks (or shadows), which represent the high price, often form it, but if one of them lacks a wick, the candle body may also do so. In this situation, the high price corresponds to either the available cost or the close price. Similar to dojis and hammer patterns, small bodies may be found in these two tweezer-forming candles. The more weight that can be placed on the tweezers' the longer wicks or shadows in the event of a subsequent price reversal.
The tweezer top is not regarded as a powerful signal in and of itself; it should be noted. One must wait for a confirmation candle to form shortly after to verify if the price has reversed or not.
How to Trade with the Tweezer Top Pattern
The tweezer candlestick is a reversal pattern; therefore, before entering a trade, investors should ascertain the direction of the trend. Looking at swing levels makes it simple to spot up-trending and down-trending markets. Investors should know how the price chart forms higher and lower lows.
To ease the trading of tweezers, traders can adopt the following steps;
After identifying the market trend at given support and resistance levels, investors can identify the point of interest area, which is the supply or demand zone from which the price previously had a strong reaction. Investors should therefore record critical places where a dramatic market reversal may start.
After discovering the swing levels, find the tweezer top and bottom from the resistance and support levels. As soon as the second candle closes, confirm that the trade entry is still legitimate.
How to Identify a Tweezer Top Candlestick Pattern
Most trend reversal patterns are easily noticeable on a chart following a price direction, and so is the tweezer top.
To identify a Tweezer Top candlestick pattern, a trader must be able to define their market entry point carefully, locate stop losses, and set reasonable profit targets before placing any trade.
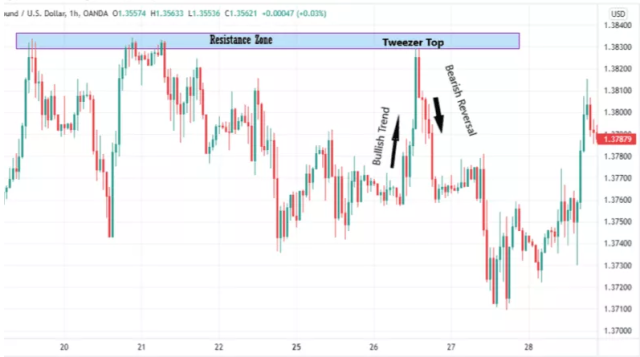
Look for a pricing trend that is rising. A trader must spot a tweezer top pattern at the end of an uptrend; when the market prices swing high. This is because the tweezer top is a bearish reversal pattern, so the price must first be advancing strongly in a bullish direction.
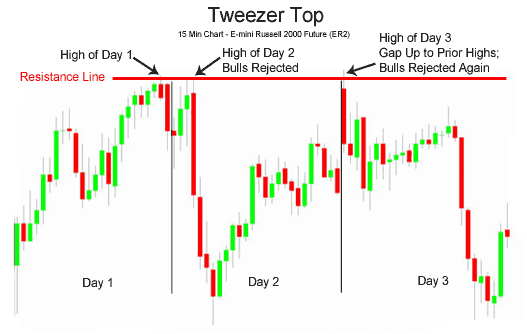
The two candlesticks forming the tweezer top pattern should be reflected at the same level. This suggests that the security being exchanged has reached a level of resistance. The resistance level indicates that while the bears attempt to sell, bulls are unwilling to purchase beyond that higher price.
Start looking for an entry point into the bear market by selling anywhere below the second candle of the series. Afterward, figure out your stop loss above the extreme of the pattern. Set your profit target below the formation.
Technical indicators can also be used to find better positions and make better decisions.
How to Set up a Tweezer Top Candlestick
Two neighboring or two candles with three to four little candles between them make up the tweezer top candlestick pattern. Any candle of any size or color that is a part of an ongoing upswing may be the initial candle.
The only exception is the Four-Priced Doji Candle, which has its open, high, low, and close values all equal. Following such a bullish candle, a second candle forms whose peak price is comparable to the previous one, resulting in a tweezer top pattern.
Again, unlike the first candle, this second one shouldn't be a four-priced doji. Between two candles, there can be a few smaller ones with the same high price. The size and color of these two candles are unimportant, but their high pricing ought to be comparable or close to one another.
The formation of the first candle of a good tweezer top pattern must occur amid a continuing upward price movement. When a tweezer top candle pattern forms, it suggests that the price may reverse course and that the current trend of green-colored candles will eventually end.
Many traders might prefer to hold off until a third confirmation candle forms. If a red confirmation candle forms, it is further evidence that the uptrend has stopped and that prices will soon begin to decline. It's time to go short on the stock (sell) or cut the losses if already holding an extended position.
Tweezer Top vs Tweezer Bottom
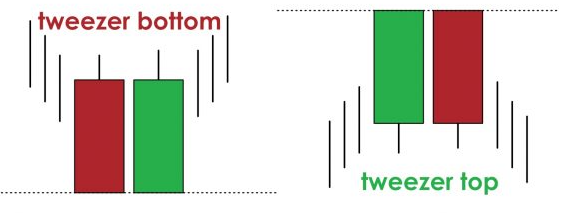
An indication of potential negative pressure, a tweezer top is a combination of bullish and bearish candlesticks at a swing high. On the other hand, a tweezer bottom is a bullish reversal pattern at a swing low that indicates a potential bullish price trend.
Traders can use the tweezer candlestick to determine entry and exit points because it has bullish and bearish forms. A bullish trend's peak is marked by the tweezer top pattern, which shows that the price has caught the attention of bears. As a result, it provides a sign that bulls should close their positions because there's a high chance of trend reversal patterns.
The tweezer bottom pattern is significant for Forex traders since it is closely connected to a market entry. It is at a swing low and has a large bearish daily candle, showing the price bears are active. The price does, however, increase the next day as a result of buyer interest. Traders may therefore view the moment the second candle closes as a buying opportunity.
Tweezer Top vs Evening Star
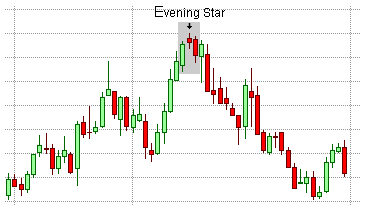
The evening star is a reversal pattern that usually has three candlesticks and appears after an uptrend.
Typically, the body of the first candlestick is strongly bullish.
The body of the second candlestick is diminutive. Either way is possible. Another scenario is that the second candlestick has no body (a doji).
The third candlestick in the pattern has a solid bearish body and closes within the first candlestick's body, preferably past the candlestick's midpoint.
Best Forex Trading Course

Ezekiel Chew is a renowned forex trader, trainer, and industry expert. He has trained professional and retail forex traders as well as corporate finance players like bank traders, money managers, and asset investors. From his trading experience drawn from over 20 years of trading the forex markets, he has created a comprehensive forex trading course known as “the one core program”.
Ezekiel asserts that the one core program is designed for the ‘committed learner', so previous trading knowledge or experience is not required before you can enroll in the program. The program comprises over 60 video lessons that teach proprietary trading strategies that are backed by mathematical probability and technical analysis principles.
The one core program has been proven to be highly efficient as it has generated millions of US dollars for Ezekiel Chew and his students. There are numerous testimonials from students that have graduated from the program and are now making six-digit figures per trade just by applying the techniques learned from the program. The one core program is available on the Asia Forex Mentor website; which is a forex trading blog that has been existing for over a decade.


Best Forex Broker
Conclusion: Tweezer Top Pattern

Traders of financial markets find Tweezer patterns reliable as price reversal patterns that place them at the top of a new trend and explain buyer and seller sentiment.
The Tweezer Bottom candlestick patterns indicate a downward trend. A bearish tweezer candlestick formation suggests that the current decline will continue. It is advisable to combine it with other indicators for profitable trading. if The low of the bullish candle marks the support level for the following day. The bottom candles' close equivalence in low indicates how strong the support is.
Tweezer bottom candlestick patterns, which are nearly equal in low, serve as a strong indicator of the support. This indicator can suggest that the downward trend might eventually turn upward. The bulls then enter the market and drive the price upward. When the bullish candle forms the next day, the bullish reversal will be confirmed.
Tweezer Top Pattern FAQs
Is Tweezer Top Pattern profitable?
The tweezer top formation is an easy-to-understand trading indication and highly profitable. A trader could profit immensely from the identified bearish reversal indicated by the Tweezer top pattern. It can be accompanied by other technical indicators for a more reliable result.
What are tweezer tops and bottoms?
Tweezer top and bottom, which are combinations of numerous candlesticks, typically happen towards the end of uptrends and downtrends and indicate a trend change.

