
Want to jump straight to the answer? The best forex broker for traders is Avatrade
The #1 Forex Trading Course is Asia Forex Mentor
One of the easiest ways to earn money by trading forex is using a trend line. A forex market will trend upwards or downwards. Whenever there's no trend, markets are in consolidation phases.
New traders can grasp the concepts of trading with the simple aspect of drawing correct trendlines. Entry points are selling on a downtrend and buying on an uptrend. But good trading requires more than trends.
In this post and under the insights of Ezekiel Chew, a lead trainer with Asia Forex Mentor, we'll dig deeper. Right from the drawing of correct trendlines to see how best trading strategies can be optimized with price movement.
Trendline Trading: What is Forex Trendline Trading?

Expert market participants can tell you how useful trendline trading is in terms of profitability when done right. Upcoming traders like the simplicity of the concepts with trendlines.
Generally, the trend gives you a clear chance to rake in some profits, so long as the direction remains. The other beauty of trendlines is that they form a solid basis for verifying entries and exits for any trading strategy that relies on support and resistance levels.
You'll find many variations in how traders draw trendlines in their market analysis. All in all, it’s not complex if you capture the right concept from inception.
The downside within the wrong drawing of trendlines can be catastrophic to your forex career. You'll make very wrong decisions with wrong trendlines. One significant fact is that a trendline should not have a breach anywhere between the two positions (price swing highs or lows) of an asset's price.
This review will find a fine-detail procedure for drawing trendlines over prices. See how trending helps in technical analysis, trading strategies for the same direction, or trendline breakouts.
How to Draw Trendlines
Drawing trendlines is easy if you grasp the main concept.
To draw correct trendlines on price charts, you connect a straight line with two swing highs or swing lows on a chart.
A trendline helps traders with two main pillars:
- One is giving the overall direction of price within a timeframe
- The next is helping a trader make a potential prediction of the prices in the future time frames in the light of support and resistance levels of a forex market
Therefore, through trendlines, traders have an opportunity to trade along with the trend or look for possibilities in the counter-direction.
One bonus insight with trend line trading is that traders can gauge the current trend's strength. They can also see its potential regions of exhaustion and probable reversals.
In actual capture of the swing highs or lows, it's important to capture the bodies of the candlesticks (closing prices). Ideally, ignore the shadows of the candlesticks. The line should rest on the bodies of candlesticks.
The highest position in the image below captures three candles, A, B, and C, locating the swing highs.
The highest candle is the middle candle B which has the highest closing prices. The price navigates a very smart curve with the price reversal on the price charts.
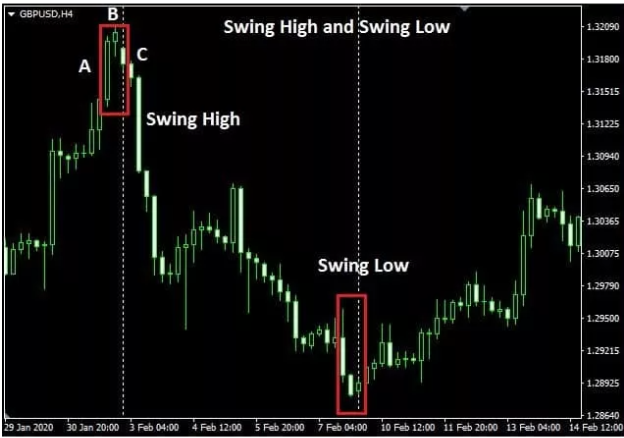
The swinging low in the image above also navigates another turn and shifts from the downtrend line.
To draw a downtrend line, you connect the two swing highs in the image below (Swing highs A and B).
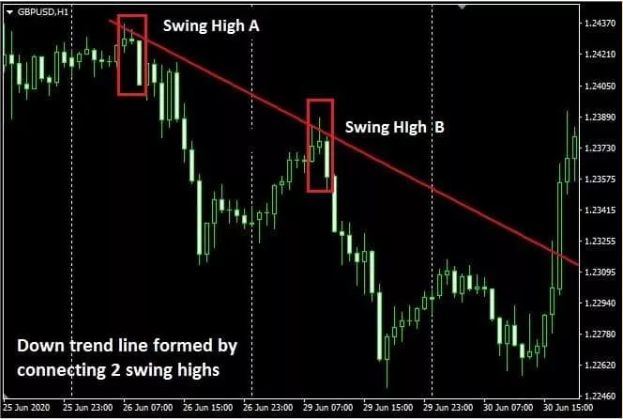
Notice the view of the down-trending line in the image above. There's no breach anywhere between the two swing highs.
When prices form a candle rising to touch and break past the line, it will automatically breach or invalidate the entire line. The reason is that there'll be another position with swing-higher prices in between the trend.
Constructing an Up-trending or Rising Trendline
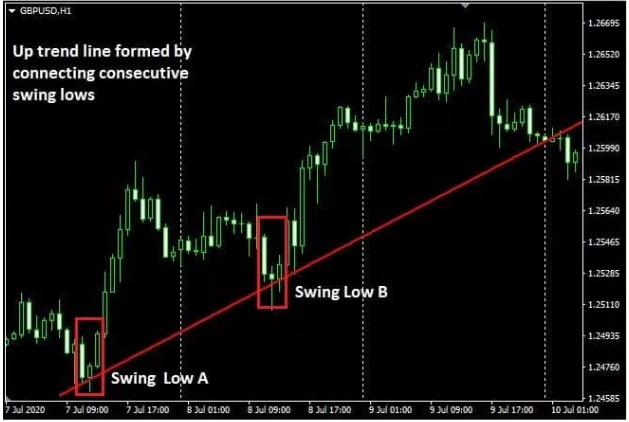
The rules for drawing an uptrend hold. However, you are looking for a swing low as the price rises with the uptrend line.
Again, you can ignore the shadows on the candlesticks. So make sure the line rests on the bodies of the candlesticks at both positions – the swing lows.
The breach towards the extreme highest point breaks the price trend. Traders should look to exit positions on the uptrend line and hopefully wait for trend reversals.
Validation of a Trendline
You already know that a price trend comprises two positions – swing highs or lows. And the trendline remains in focus unless a breach or invalidation happens.
Some circumstances offer validation or further guarantee when a third swing high comes into focus while adhering to the rules of the trendline. (Same applies when dealing with swing low positions)
Looking at the image below, our initial trendline connects two swing highs, A and B. However, looking at swing C, it does not breach the trend line formation through subsequent price action.
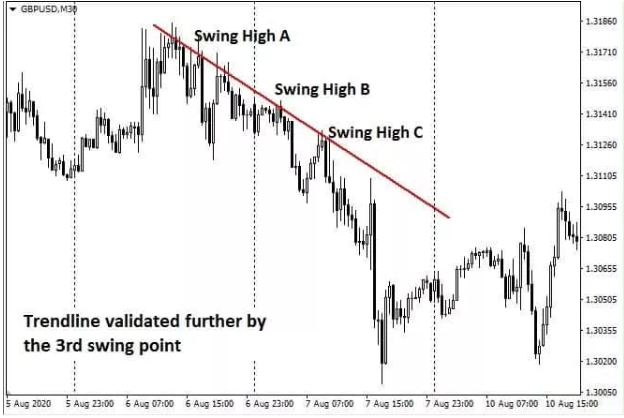
Therefore, the inability of the bulls to pull back the prices past the trendline gives us further proof of the trend being in force.
Trendlines help traders notice the formations of support and resistance along with them. Instances of validation of a trend by a third, fourth and fifth swing high or low facilitate your trade entry decisions.
It's an opportunity to get a clearer focus via technical analysis and know who's controlling the markets, either the buyers or the sellers.
By extension, traders can either choose to take profits or continue riding the trend to earn more profits. Also, a trend reversal trader will grasp the insight with a dominating uptrend line and know whether to wait longer or jump in accordingly.
Best Time Frames for Trendlines

If you master drawing a trend line correctly, you have a lot of opportunities open for you.
Why?
Trendlines apply to any time frame of price movement. You can work minutes, 5 minutes, half hours, hours, and all the way into months or years.
The other approach would be to use price action via a hybrid approach – where longer time frames help you get the longer-time trend.
Next, you can narrow it down into shorter time frames to look for opportunities within them – while working in the direction of the long-time trend.
The longer time frame, in this case, gives you a clearer trendline direction within the scope of support and or resistance formations.
Types of Trendline Forex Trading

Trading in the direction of a trend line builds on and incorporates many trading indicators and strategies. Also, traders have opportunities to trade successfully once the direction reverses. They comprise the reversal or counter-direction traders.
Working with trendlines is a great way to enhance your market analysis. You can enrich your career in the form of a top-down analysis. You narrow down to support or resistance and maybe further into patterns or a trend channel within target timeframes.
For a practical instance, a trader can approach by identifying an uptrend in a day chart. The next step will be to narrow it down to the 4-Hour or 1- Hour charts. Essentially, it's aiming at trading the forex market in opportunities at lower time frames but in the direction of the larger time frame.
The ideals of working with trend line support or resistance increase a trader’s analytical grasp regarding a price move and trading strategies. And that works for positions along or for the counter-trends.
It's worth bearing in mind that despite the foresight of support or resistance in the respective strategies or timeframes. In forex trading, things can change at any minute concerning changes in market sentiments.
In bullish trends, whenever buyers gain momentum, the chances are that they can push prices past resistance zones. And that does not matter how often the trendlines have been breached in the past. The same reality happens but in reverse for support zones. Sellers can burst the price past support zones set in past price movement(s).
There are two sets of facts for trendlines whenever prices hit the support or resistance:
- First, if prices fail at breaching against a set trendline, the current trendline is set for continuation (use continuation trading strategies).
- Secondly, if prices hit and breach a set trendline, opportunities for price reversal come into the picture.
Trendline Trading Strategy – Trend Continuation
When eyeing the continuation of price trends, traders plan to enter the market at the best opportunity.
The aim is to verify things with technical analysis before jumping in to ride on the profits toward a current trend.
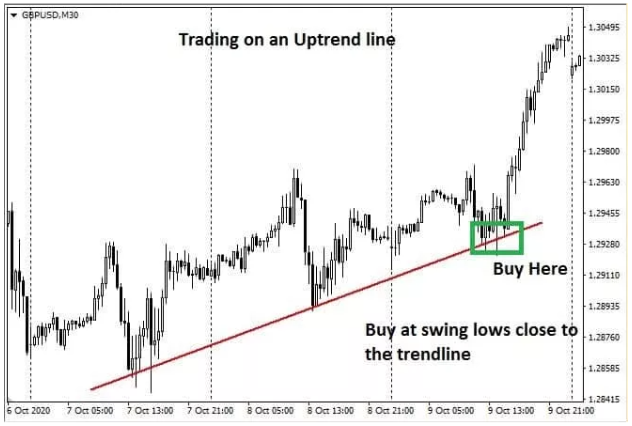
Our analysis from the image above shows the currency pair GBPUSD, with price movement on a half-hourly chart with a rising trendline.
The trader validates the trend using two swings of low prices. Next, the trader prepares a trading plan – which allows for confirmation via technical analysis when the prices fall back to the rising trendline.
But the price movement does not invalidate the uptrend line in subsequent price action.
The entry position for the above security's price is to buy once the market touches the trendline – at the third swing low. The buy limit is set at five pips below the trendline. That's the best entry position with the best value for the trade.
Next is analyzing the same but applying the same concept for a downtrend.
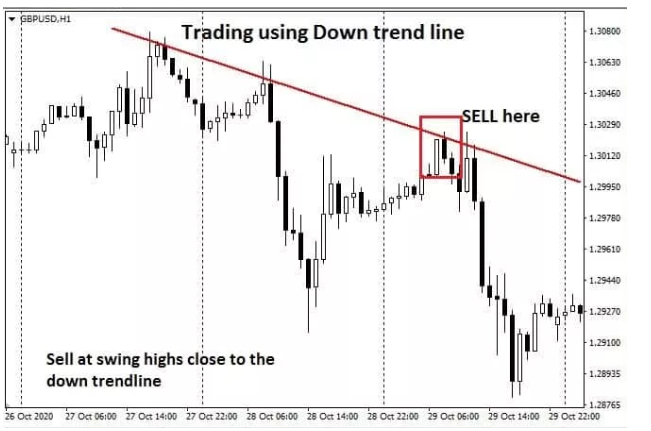
In the above image, the currency pair- GBPUSD is on a downward trend on the hourly chart.
A trader notes the downtrend but waits for further validation when the market pulls back but does not invalidate the trendline.
The best point of entry is right at the third swing. A sell limit order is the best plan to ride the market along with the trend as the prices swing lower.
A careful inspection will help traders by avoiding false breaks. In reality, the price spikes above the trendline momentarily, but none of the candles closes above the trendline. The best way a trader can handle false breakouts is by refining their price action trading masterly.
Analyzing Strength Using Angles and Slopes
When analyzing markets using trend lines, you can view the support and resistance zones as they shift alongside the trend. That allows you to spot the best entry points, but there’s more. Trendlines give you a feeling of strength or weakness of price movement at any point.
And one way to dig deeper into the strength or weakness of a trend is by looking at the angles of the trendlines. And that adds to your insights of technical analysis regarding trade entry opportunities – which you must approach with your best trading strategy.
Generally, trend lines with very sharp angles designate huge forces of prices falling downwards.
That applies to downtrends. Else, a wider angle of the trendline is a display of weaker prices movements along the downtrends – which may reverse much faster than the case for a sharper angle.
In better words, the shallower the trendline, the higher the risk of reversal. At that occurrence, traders should reduce exposure by either taking some profits or exiting trades.
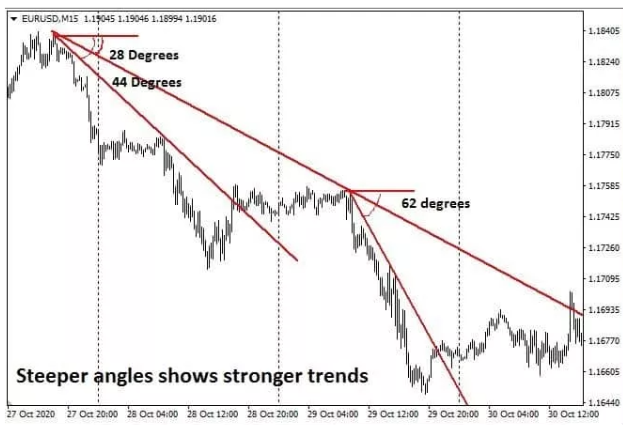
In the image above, see the longer trendline – it is sloping at an angle of only 28 degrees. The slope is lower, plus it depicts the larger direction.
Look at the two trends that shift lower from the main trend. The first one is sloping more sharply at an angle of 44 degrees. And the next is the sharpest one, with a sloping angle of 62 degrees. In both, the trendline showing an angle of 62 degrees shows a more vigorous bearish intensity than the comparative one with a slope of 44 degrees.
The insight is that at an angle of 62 degrees, a trader will hit target profit faster than 44 degrees.
Trendline Breakout Trading Strategy
Traders should know that every confirmed trendline will never remain so indefinitely. With time, trendline breakouts will occur.
At one point, sellers are in control, and buyers struggle simultaneously (downtrend line). The next shift sees buyers in control (uptrend line) and sellers occupying the struggling seat.
Notably, during consolidation, buyers and sellers almost struggle with no party being able to take control until a breakaway happens with one party losing control. The key is to include necessary steps in a strategy for when the direction reverses.
Trendline breaks happen in two scenarios:
- Prices or candles close below the rising trendline for up-trending markets
- Prices or candles close above a trendline for down trending markets
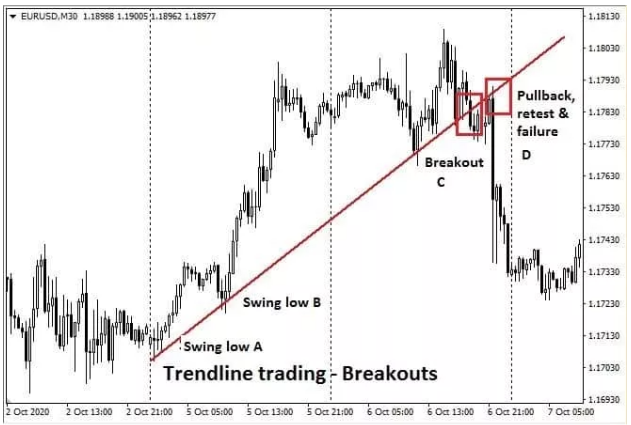
The image above shows swing low positions A and B within an uptrend line validated by the swing low at point C. But see the upswing at D, whose downturn breaks the trend.
Generally, along with the uptrend, the trendline acts as support, but once the prices break the trend, the terms change, and the trendline now becomes the resistance. Now, once the uptrend breaks, traders wait patiently and make plans to enter the market – but with sell or short positions.
The best position to dive into the markets is at position D with a real trendline break, and many traders join in to target price moves lower.
A key point to note here is that the strategy to enter or leave the market is different for the uptrend as it is for a downtrend. More important is to carefully study price action and analyze candlesticks at trendline breakout every time before opening trades.
A great tip is to validate the new downtrend using the next lower timeframe available.
Above, the chart is EURUSD – 30 minutes. Therefore, the best applicable timeframe to validate the downtrend would be EURUSD – 15 minutes timeframe. That helps avoid false breakouts that plague your capital if you dive too early into a market.
Trendlines in Other Strategies and Patterns

Approaching profitable trading using trendlines is pivotal for approaching markets the right way. If a trader can plot trendlines correctly, they open up many possibilities of analyzing markets in numerous ways that fill into other strategies and patterns.
Trends are a firm approach to validating patterns which add up to helping traders analyze and correctly predict market movements with an appropriate trading strategy.
Looking keenly, all market patterns rely on a straight line for a trend line. For instance, the neckline that applies to the head and shoulders pattern is, first of all, a trend line. And it's applicable for both scenarios, inclusive of the inverted head and shoulder pattern.
There's no doubt. Being an analytical trader who approaches markets correctly, plotting trend lines is a bold step. However, taking bolder and more analytical steps is a great way to go about it. It requires stepping further into analyzing the pattern formation and validations as a step further after a keen analysis of trends.
Limitations
The trading strategy for trend lines appears very simple in theory. But the practice seems so different since trendline bounces in financial markets are common.
Although drawing trendlines is very simple, you'll be shocked to see how traders practically do it. Each trader seems to have their own conceptions of trendlines, ending with wrong predictions.
Lucky for you, this post has an elaborate coverage of the concept up there.
A mastery of correctly drawing trendlines is not a green light to open trades. A good trader pays the price by adding two or three steps of analysis and verifications.
In reality, asset prices are a confluence of many things that happen concurrently.
Markets receive and perceive news differently, which causes spikes and prices to sway far away or invalidate a current trend.
The essence of being a good trader is to be cautious. While you may have done the best analysis, your offensive is intact. Remember to cover your defense with a stop loss position.
Lastly, in financial markets, all the following should not be taken as investment advice:
- Any confirmed trendline, whether a downward trendline, downtrend line or a falling trendline.
- Any support line or resistance line, or parallel trendlines
- Any lower trendline or formations that combine trendlines
- Any long term trend or line trendlines
Best Forex Trading Course

Are you looking for the best Forex trading course? Join the world's best trainer/mentor – Ezekiel Chew.
Ezekiel is the mastermind trainer behind Asia Forex Mentor and the One Core program, which trains beginners and expert traders in making 6 figure trades – even for retail investor accounts. The course is a life-changer that is backed by theoretical practice and numbers from a trainer who's trained institutional traders and banks. One Core Program covers all concepts applicable to currencies or complex instruments
One core program is a rare course that features live trading and mentorships by the lead trainer. One other hidden characteristic of Ezekiel Chew is his way of giving to the community – by training others willing to invest in knowledge that he shares as a living example and earns from FX trading. You can subscribe today for a free eBook on the masterly of successful trading. Or chat with the team. Lastly, the Asia Forex Mentor website has tons of helpful material you can explore, all for free to help you make up your mind and prepare to join the One Core program.


Best Forex Brokers
Conclusion: Trendline Trading

Trendline trading is popular among all cohorts of traders – new, intermediate, and advanced.
One critical component of trendline trades is plotting the trendlines correctly. The key here is:
- Connecting two swing highs for an uptrend
- And to connect two swing lows for a down-trending market
Each time traders look at the markets; they can tell the general direction by approaching the markets via trend lines.
It can be either a falling trendline, a rising trend, or in consolidation. The ultimate beauty of trendlines is that it applies to all time frames and within a trend channel.
If you are looking to capture a few pips in minutes, half hours, or looking to take a month or years, trendlines show you the general direction.
Agreeably, trendlines have their own share of woes.
But, they are an essential ingredient if you look at them as a stepping stone to help you fine-tune other strategies and set off analytical approaches in forex trading.
Overall, trendlines allow you to zoom into lower time-frames and see the reality of actions with the main direction in mind. With the main direction in mind, you have opportunities at lower time frames. Trendlines favor both traders – those looking to trade on the trade and those targeting reversals.
A price trend does not remain forever.
As it trends, the support or resistance zones move with it. Therefore, traders get further insights from that. And the facts remain that once a trend is invalidated, it ceases to be, and prices may ultimately change course.
Trendline Trading FAQs
How do you trade a trendline?
The logic around trading a trendline follows a formal procedure. One is to establish if it’s a downtrend or an uptrend.
Experts advise new traders to keep off markets whose prices are moving within a range of what experts refer to as a market consolidating or moving sideways. As such, neither buyers nor sellers seem to control the market.
When a market is trending downwards, it’s time for traders to sell or go short. Else, if the market is trending upwards, it’s an opportunity for traders to go long or open buy positions.
Also, when making the trades, it's far more important to go extra steps other than establishing a trend.
Good traders pay the markets by following a process of verifications. Experts summarize the rules into verifiable steps, and you can best refer to that as a trading strategy. In simpler words, a trading strategy is a set of rules written by oneself to combat the market price volatility.
Trend verification is one ingredient of a great trading strategy. A great trader looks deeper beyond the trending.
Key questions to ask after you establish a trend are:
- What timeframe does the price trend occur? Higher timeframes offer more realistic trends.
- What is the next probable position of a swing high or a swing low? These are probable areas where you can join the market or look for a break from the main direction to trade accordingly.
- Are there peculiar formations or shapes that are common within price action? The formations also help you spot a high probability setup with the best value for a trade.
Trends never live forever. As a trader, all you require is knowing your strategy and working with the rules for any price move.
For instance, a reversal trader never falls into the temptation of picking trades along with the trend. They follow along with technical analysts until prices break sufficiently.
Final note, trendlines give you a certain level of assurance. After doing your trendline analysis homework well, see if you can verify price direction by eliminating a false breakout.
Check with two indicators before diving in when the price touches your target—also, plot two probable points: entry prices and exit points.
Is Trendline Strategy Profitable?
Trendline trading is profitable so long as you join the trend at a very high-value price. The best way to approach trends would be to establish the trendline first. It should not have a breach anywhere in between.
After you establish the trend, look at the next probable areas for a swing position that helps you validate the trend itself.
Once the swing position establishes, it's your chance to work with a stop loss adjacent to the trendline but a few pips away and enter a position in the direction of the prices.
Once the trade goes live, do not leave it at that. Target to take profit at the next swing high or low.
Another key component of trendline trading is the correct plotting of the trendlines.
Once you are clear with the concept, it’s your chance to look for opportunities in the direction of the trend or the reverse direction if that’s what your strategy looks for.
To trade profitably, pay your dues to the market. What do I mean? Do further analysis to help your trades. This is where most traders miss it by jumping into trends without making two, three, or four verifications before joining.
Do trendlines work in day trading?
Trendlines trading strategy is beneficial for day traders. They work on any timeframe.
For a day trader, they help establish the direction of the prices. And with that comes opportunities to trade along with the day's trending direction or snipe at lower time frames.
Day traders close their trades by the end of business daily. Trendlines will work for them if they correctly plot a support line or resistance line and can trade in the general direction of the prices.
However, some assets are highly volatile in the financial markets. Prices may swing rapidly within the days' timeframe.
For instance, if the trendlines or resistance level is broken or invalidated by a security's price, positions banking on selling pressure towards a lower swing stand to lose as the market shifts in the opposite direction.
It would be best to take on the trendlines trading strategy with the mastery of another indicator. Also, the trader must be able to make quicker and more accurate decisions within the time frame of the day.
We have no reason to discourage traders from taking on trades after doing trendlines within the day.
What matters most is if you have done enough analysis and target to minimize your own risk.
Peculiar enough, a trader can spot a very well-trending asset using the days’ time frame. It's up to them to jump in and out by close of the day or go into it several days- provided they rake in some profits.


