
Want to jump straight to the answer? The best forex broker for traders is Avatrade
The #1 Forex Trading Course is Asia Forex Mentor
Many traders have different ideas regarding the support or resistance level. In this post, however, we'll walk with Ezekiel Chew, a successful trader cum mentor, to give guidance on the best ways to locate support and resistance zones. Ezekiel has a decade of experience trading and training that suits both individuals traders and institutional investors. His training, the One Core Program, is among the top ten globally, having trained institutional investors in large corporations holding billions of dollars in Forex capital.
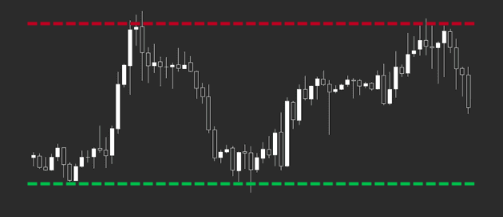
One key thing that Ezekiel trains regarding support and resistance are that both are dynamic regions. And not static as most training shows. Therefore, the tendency to move away from drawing a single line sticking to a price. Ideally, the support regions see prices bouncing from a floor back to higher prices- it's a region, not a single price or line. Regarding resistance, prices hit the roof and get rejections before eventually making turns to lower prices.
A great tip is to watch price behaviors, especially at higher time frames. Once a trader can plot the support or resistance zones and the demand or support regions, it's time to look for an entry. Realistically, it's not a game of spotting Support and Resistance and entering positions. No. It's time to confirm price directions with candlesticks and other indicators. Plus never forego checking on world events that may affect prices.
Overall, Support and Resistance trading in Forex works with the rule of thumb – selling high and buying low. But, working with the key steps above only requires your patience, excellent analysis, and good timing when you open positions.
What is Support And Resistance Forex Trading
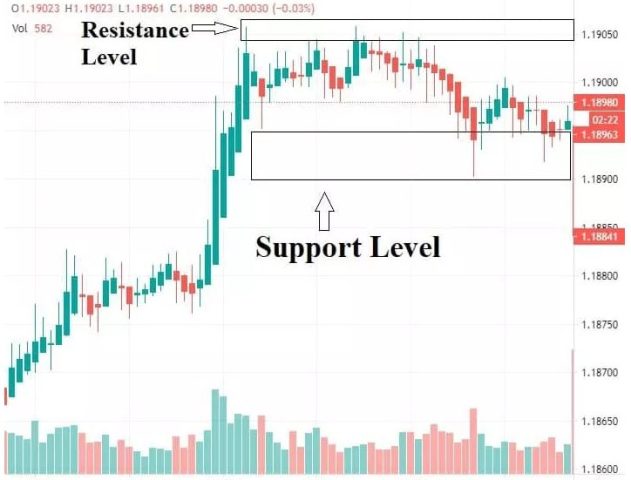
Agreeably, we are in the practice of navigating away from the notion that neither support nor resistance is single lines or figures. And neither should they be round numbers. Support and Resistance is not a horizontal line or horizontal line, rather, it's a zone or plane of prices.
Ideally, they account for dynamic planes that keep shifting. The shifts see prices break support after testing severally. Breaking support turns it into resistance as the prices may only look for another support region – lower in the chart.
Regarding resistance, prices keep hitting a barrier region, and when they break past, another zone of higher prices comes into focus as the new resistance. The earlier zone now becomes support.
In Forex trading, support regions see buyer interests fill into the momentum over time. It's also the demand region on a chart for any asset where moving averages eventually point upwards. Price reaches lowest lows and many sellers make trading decisions to exit positions for any asset with open positions. The persistent increase of buyers shifts prices upwards towards the zones of resistance.
Again, similar but opposing movements gather momentum within price zones of resistance. Sellers keep piling over time, and that is within the supply zone. Eventually, mounting selling pressure pushes prices downwards towards price floors.
Support And Resistance Trading System

The support resistance trading system helps target the correct entry and exit positions. Since prices are not static but dynamic, traders must be aware that prices will keep testing the regions time and again. Eventually, there’ll be a breakaway past resistance or support or in the opposite direction.
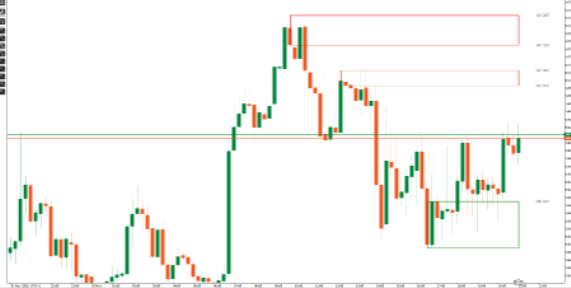
The support and resistance zones are not static. They keep moving along the main trend, and the idea here is trading without sticking to single lines. Therefore, a good/winning Forex strategy must account for working within the dynamic SR regions.
When trading, be open to searching for opportunities by betting on the price direction both ways. It's either a breakdown into the direction of expectation or towards the opposite direction.
Taking a good trade while prices bounce in the direction of expectation can be a big winner. And when the opposite happens, a trader should exit with a small loss and live to trade another day.
Support And Resistance Indicator
While analyzing your charts, most traders tend to apply a manual model to locate the support and resistance zones. However, the truth is that MT4s have inbuilt tools and add-on indicators to highlight the same for you.
And the use of the software is a better way to remove the ambiguity, plus it frees you more time to check with other indicators as you analyze the data and prices. More so, the software or MT4s inbuilt indicators can plot the zones and not simple price points.
Whatever model you use to locate the support or resistance zones, the following rules hold true:
- With major support, the actual price lines will be higher. Meaning, that buyers are gathering momentum within a range or zone of prices.
- At resistance areas or zones, actual prices or price lines are lower as bulls attempt to push prices further upwards into the zone. It's time for bear traders to sell.
Lastly, locating the Support and Resistance zones is not a green light to pounce and open positions in a market. Hold on, and seek to verify if everything fits into your account of the overall strategy. And the strategy comes with several components to help firm your decision to open a trade or not. An ideal strategy should not leave you feeling lost – especially when it rules that you open no trade. Idealistically, a strategy prioritizing capital protection first.
Support And Resistance Zones
The idealistic model of moving away from support and resistance areas as simple price lines or exact numbers fixed on a chart has one great bearing. Prices are not constant for any asset. In fact, they are not bound to follow your wishful directions. It's best to exit trades or positions when your predictions go wrong.
More so, price lines in actual occurrence will undershoot or overshoot the single price lines at a support level. Fixing support level and resistance to a single line will push you into a trajectory of either entering positions too early or too late.
Hence, the whole idea of working with zones and not lines gain ground here. The other idealistic way to approach it is to be modest. Not too ambitious and never too late at the same time. Taking a little more time frames can do the magic trick by eliminating false breakouts resulting from any unexpected market news.
Essentially, while working with timeframes, it's best to wait for candles to close – allowing several price tests to give you the ultimate direction. Pouncing on a market while the candle is halfway is rather too fearful or greedy – and that is part of what we avoid.
How to Find Support and Resistance Levels
Having moved away from the support level and resistance level being single price lines, the location of the zones gives you a whole idealistic vision of where to approach the market from.
However, you do not work with a zone at the making of trade entries. You'll have to work with a target price approaching a pre-set target. And your ideal open positions will fall within a set price level or range. That is if support is broken (price drops) and also price hikes for resistance too.
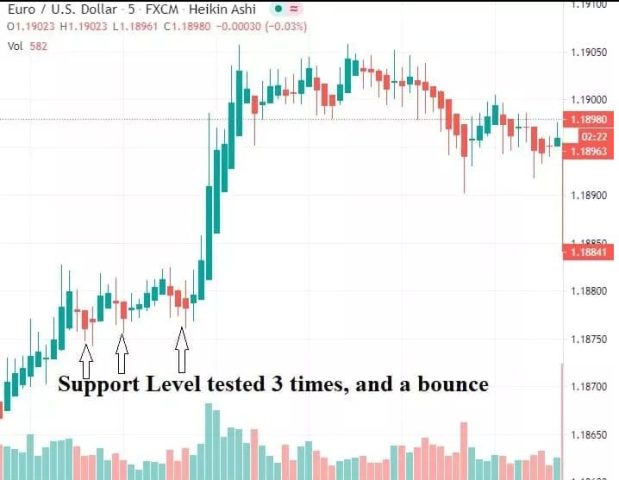
There are extreme points in both a currency pair's Support and Resistance structure. Now working with the extremes, have an open mind. Most price lines approach the price level of resistance share/areas or where support occurs for three trials before price approaches huge price moves.
Sitting at bay and watching is sometimes the best way to approach price levels and price breaks. Facts remain; support and resistance will always be hit at one time or another. A patiently waiting trader can identify support and sense the market intentions just around major price breaks or price falls.
Look for instances of trading opportunities by studying the candlestick chart. Key concepts of the candlestick shadows and shapes will form: double or triples for both bottoms and tops within specific timeframes. The wait for support resistance is always worth everything – other than spotting the SR. The whole idea is to use the zones of major SR to analyze and make probable predictions. And, of course, all this should happen under the backdrop of risk management – no trader is a master of the market.
Over long time frames, a market moves from the resistance area towards the support within a general trend.
Most brokers allow demos where you can see a live example of Support and Resistance in a risk-free mode.


Support And Resistance Formula

The Support and Resistance formula works around a median price zone – better known as the pivot point. A pivot point is arrived at by technical analysis. It determines the exact price point where the trend will go either bullish or bearish – and this convention is used the world over.
The formula for calculating the pivot point is as below:
- Pivot Point or (PP) = (High + Low + Close) Divide by 3
- Resistance One or (R1) = (PP x 2) – Low
- Support One or (S1) = (PP x 2) – High
- R Two (R2) = PP + (High + Low)
- Support Two (S2) = PP – (High + Low)
- R Three or (R3) = High + 2(PP – Low)
- Support Three or (S3) = Low – 2(High – PP)
Note: this should not scare any trader since most of the calculations here are automatic on most indicators. However, it's worth mentioning that some may require you to tweak things around to suit your case. Also, many online analysts help you do this, and you are only required to follow a credible channel or analyst online.
Overall, the beauty of knowing the inputs into the formula only makes you better at tweaking everything. So it’s worthwhile to know how to derive the components with support and resistance levels – the formula way.
Your knowledge of working through the formulas here will only give you probable zones with price oscillations. Some currency pairs observe the resistance levels in line with the support and resistance formula probabilities, while others won't. As such, it remains the trader's duty to fix a working strategy to thrive within the peculiar nature of the market.
Support and Resistance Forex Trading Strategy
The essentials of trading by approaching markets with the rule of thumb all over the world apply. Buy Low and Sell high works around the confines of support and resistance. In fact, most strategies fall within, including those working with Bollinger bands and swing trading.
For purposes of this write-up, we’ll cover an example per scenario:
#1. Bounce Strategy
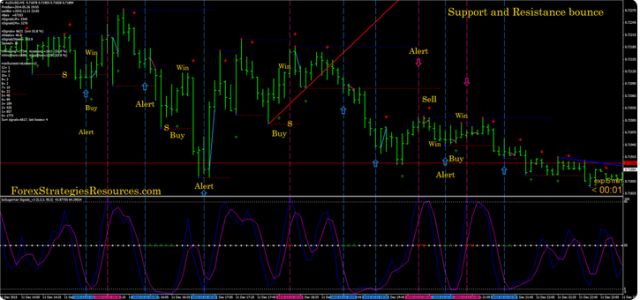
As the name suggests, traders approach the markets and enter at the right price when price-lines approach either support or resistance share. A great tipper here is to wait for markets to form confirmation candles. Otherwise, markets are known to change directions even when your target was to ride the bounce.
#2. The Break Strategy
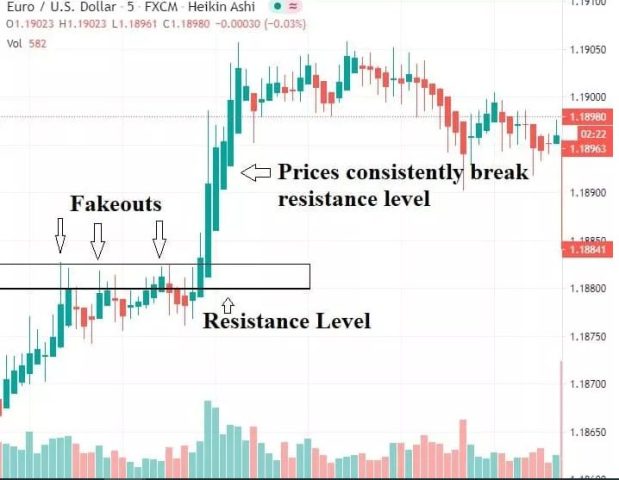
With the break strategy, traders allow the prices to move past the support or resistance zones but join into the breakouts at the right time to catch the wave either way.
And again, the critical point here is to join in after confirming breaks. The main essence of confirming breakouts is to sift away chances of false or fake breaks.
There's raging debate around handling breakouts that end up with wrong positions. And it rotates on whether one should be aggressive or conservative while approaching the positions with the strategy.
For aggressive traders, watch for if the price lines test consistently on either support or resistance. Else, for conservative traders, the option will be to counter a wrong trade with equal lots-size, but now in opposite directions to exit at minimal losses by breaking even at least.
Eventually, patience pays when a trader can really confirm breaks by allowing one pullback at least and joining the race once the broader trend resumes. Sequentially, the target resistance turns support once a breakout happens, and observing patiently can help with avoiding false breakouts.
For each example above, all risk mitigation factors must be ingredients to your trading.
How to Find Support And Resistance In Day Trading

It's worth mentioning that support and resistance trading works so well with longer time frames. However, the rule is not fixed in stone. A good trader can still deploy the same for day trading.
The ideal approach will be starting by locating Support and Resistance via longer time frames like the weekly and daily before shifting to the four hours. And then narrow down into the intraday- shifts within lower time frames like the 15 minutes to help measure probable price directions from there.
Bear in mind that Support and Resistance regions/levels remain to be SR levels as long as they hold. When broken, they cease to be, and trading parties should search for other applicable SR levels. The idealistic note here is to notice the shifts and replot the zones accurately.
While deciding to make an entry, simply check with the longest time frames and if your intraday target timeframes hold to your target direction. If everything is clear, hold on a moment to wait for the completion of a pin-bar or engulfing candlestick to join in.
Best Forex Training Course

Are you looking for a suitable forex course? Join Asia Forex Mentor with the One Core Program. The One Core Program comes with a decade of experience by Ezekiel Chew – the Mentor and Trader who is the lead trainer.
Past students are able to bank 6 figure positions without fear and greed after going through the One Core Program. Behind the scenes, the course will build your career by taking you through a proven strategy that is backed by back-tests and has mathematical proof. It's the reason the program emerges among the top ten globally that you can opt for.
There's a host of reasons why the One Core Program builds you into an excellent trader – the mentorship component of the training process. Part of the training involves you being invited to trade live markets after running your analysis on support or resistance levels. And you do that side by side with Ezekiel Chew.
It's a holistic course – whose target is any willing learner. Willing learners here comprise individual retail traders all the way to big institutions. And Ezekiel has had experience training all among those.
As a super-serious trader, you do not have to grope in darkness and pay for costly mistakes to the merciless markets. Walk the simpler path and practice with the assurance of being a pro-trader at the end by joining the One Core Program.
Best Forex Brokers
Conclusion
Trading Forex successfully requires a great strategy. The truth is, professional traders across any time frame do their best to zoom into markets and attempt to decipher what the market price is saying. Successful trading means trading within the limits of support and resistance. The good thing with this post is that you already know why either support or resistance level is not static lines set on a chart.
Approaching trading with a strategy that views Support and Resistance as dynamic zones is the way to go. Therefore, to further refine entry points, you need a careful watch to see if there are clear chart patterns or massive breaks in your directions of expectation. The point here is to look for a few opportunities to ride your trading into profitability.
Of particular interest along have been the bounce and breakaway strategies. No matter which you go for, capturing a huge move is at the center of your successful trading. Critical inputs here go a long way to your ability to detect a false break and avoid it at all costs.
We’ve also gone through the Support and Resistance formulas where you get the pivot point and the three levels of probable resistance and support. And all these build into your analytical sharpness. However, you should not waste time doing the calculations manually. MT4s have hosts of indicators to help you automate that portion of the analysis.
Parting note – Support and resistance are suitable ways to start your analysis of markets. Never take it as investment advice – best if you start with longer time frames and narrow downwards. SR helps you get a firmer grasp of your analytical abilities to face markets.
Next, you have to infuse your positions within a strategy to help you avoid falling into ambiguities. It's the strategy bit that has the final checklist to whether you get into a market or not.
Most traders fail at following strategies and forget their roles. Never fall into that trap! Following the rules you set is a high level of personal discipline. If you fail at that, you meet a more ruthless disciplinarian – the markets.
Support And Resistance Forex Trading FAQs
How Much Do Forex Traders Make A Day?
FX trading is a complex industry. Since all brokers and speculators happen to follow their own rules, it's hard to lay hands on credible information as to how much a forex trader makes for any single day.
Perhaps, it's best to approach it via annual earnings and divide that to arrive at the per-day figures. All the same, day trading, according to the terms, is a situation where a trader closes with no trade at the end of the day. And that adds to the complexity here. Would you opt to close a trade while you have opportunities to wait for a day or two to earn some profits?
Overall, go for a solid career in trading where you are not in it to preserve a name day-trader. But go for making a few positions – even holding some for several months:
- That cost you every bit of time doing analysis and spotting chart patterns
- You make entry at the right times and capture big pips in profits
- Comprise your lifetime career
Forex is a wide world of market opportunities and timeframes you can thrive in. The broader and more professional approach is to move away from eroding your capital through greed and fear. Purpose to be in it for the long run. And this is by no means meant to offend any successful day-trader who may lay their eyes on this piece of text.
Can You Make A Living Day Trading Forex?
Yes, you can make a living from the forex market.
You can trade correctly by avoiding significant risk and be a highly disciplined trader who wins big profits to meet all your living costs. You can trade FX and make it your sole business to earn your living from it if you do good analysis.
The reason why I find it awkward is the condition to close the trades by end of business daily. Therefore, the best way is to be in it for the long run by doing technical analysis for long time frames. Why don't you slow down? Do more analysis and trade longer timeframes. Your ultimate goal is to make very few closings that hit goldmines in terms of profitability.
It's by no means a campaign to derail you from day trading whatsoever. And that's the beauty about the whole trading arena. If your strategy fits in and rakes in more profit, for whatever sake goes with that. However, few speculators will want to thrive with high tension in the erratic markets.


