

Want to jump straight to the answer? The best forex broker for traders is Avatrade
The #1 Forex Trading Course is Asia Forex Mentor
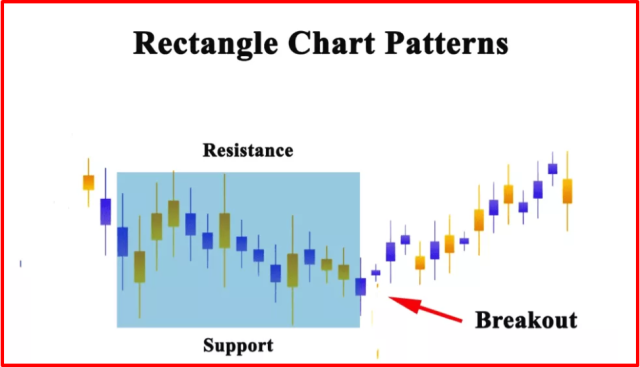
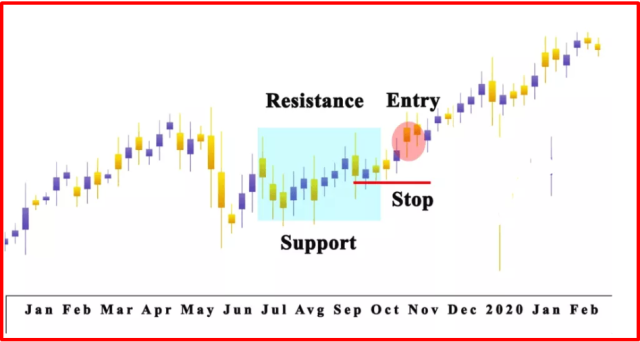
Identifying the support and resistance level is quite crucial for successful trading strategies. Many traders find the rectangle pattern on a chart and believe it is a good strategy to trade. This is a technical analysis tool that helps to locate potential levels of support and resistance.
The rectangle pattern is created when the price action consolidates between two horizontal levels for an extended period. This creates a rectangle shape on the chart. The pattern is considered complete once the price breaks out of the consolidation and moves in a new direction.
Investors buy when the price is below support levels and sell when it reaches resistance levels. The rectangle formation shows a period of buyer and seller hesitation as they make market transactions, but no one has claimed the upper hand.
To better understand the triangle pattern, we have got Ezekiel Chew, an expert in technical analysis, to share his take on the Rectangle Pattern with us. Ezekiel Chew is the co-founder and head of training at Asia Forex Mentor, one of the largest forex education companies in the world that trains people from all walks of life to become professional forex traders.
In this guide, we will discuss rectangle patterns, bullish and bearish rectangle patterns, trading with the rectangle chart pattern, and more.
What is Rectangle Pattern
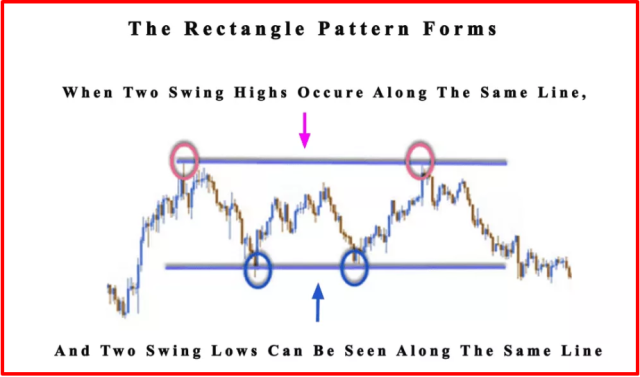
A Rectangle is a continuation pattern that develops during a trading range. The pattern may be recognized by two similar highs and lows, distinguishing it from other patterns.
The two parallel lines can be drawn from the highs and lows to form the top and bottom of a rectangle. Traders refer to consolidation areas, congestion zones, and congestion areas as rectangles.
The market is considered in a trading range when it moves between two parallel horizontal levels. The prices move up to the upper and lower levels, creating a rectangle pattern on the chart.
The upper and lower levels of the rectangle represent areas of resistance and support. The market is in a state of indecision, as buyers are unable to push the prices higher, and sellers are unable to push the prices lower.
Bearish Rectangle Pattern
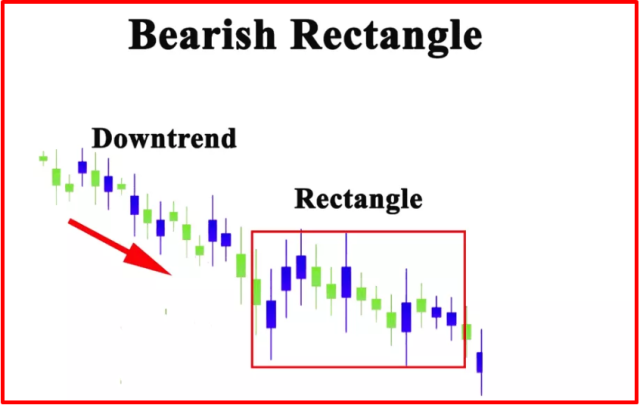
A bearish rectangular pattern happens when investors try to open short positions at the top of a bullish rectangle and long positions at the bottom of the pattern.
When traders find and verify a bearish rectangle, they should find the level of support and resistance to calculate their target profit area. The target profit area is the difference between the price at entry and the bottom of the bearish rectangle, which is typically the level of support.
If the market breaks out to the downside, traders will look to enter short positions. Therefore, the stop-loss order should be placed above the level of resistance.
Bullish Rectangle Pattern
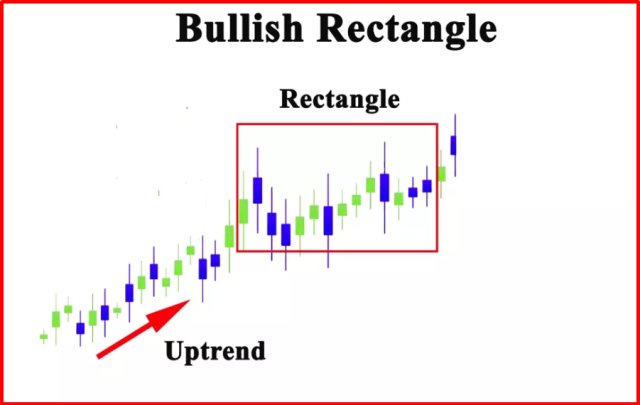
It is called bullish rectangles when investors try to open long positions at the bottom of a bullish rectangle and short positions at the top of the pattern. Conversely, the bearish rectangular pattern occurs when the price falls beneath a previous low and bounces back up. The bullish rectangle chart pattern is an example of this.
When the price breaks support and closes within the area of a breakout, in the case of a bullish rectangle, it may be seen in an uptrend when investors intend to start a long position. A break of the pattern to the upside indicates a continuation of the bullish upswing trend.
Rectangle Pattern Benefits
When applied with a breakout strategy, rectangular patterns are appealing to investors because of the following reasons:
- First, the rectangle pattern can easily be used in different markets
- This pattern is quite easy to identify on the charts
- Third, the pattern gives a clear target level for profits and stop-loss levels
- It might be used as a breakout or range-bound approach
- Finally, limit levels, entry, and stops are easy to spot and integrate with a trade
- The strategy is not difficult; even beginners can utilize it to spot a consolidation pattern in a current trend and then trade the breakout
Rectangle patterns can produce barriers. The breakouts indicate a price movement in the resistance or support level. They are signaling that they're being contacted about possible breakout trading possibilities.
Trading Tips with Rectangle Pattern
The forex market investment process using the rectangle pattern is not complicated. As an investor, you can benefit from the following tips:
- First of all, locate the current market trend
- Then, look for the other patterns before implementing the rectangle pattern
- Expect a breakout in the early stage of the trend. A candle close under or over the resistance and support is expected
- Now create the resistance and support by mixing up the lows and highs in a triangle
- Investors can forecast the breakout price by calculating the rectangle's height and projecting it over resistance and support
Trading with the Rectangle Chart Pattern
Do you know the best part of this trading pattern? Well, it is easy to estimate the target profits and stop-loss levels. This is what makes this pattern so attractive to many investors, especially beginners.
Below are a few of the steps to trade using a rectangle chart pattern:
#1. Recognize Pattern
To discover the rectangle pattern, you must first find a rising asset experiencing a period of combination.
Investing requires spotting at least two tops & bottoms, both of which should be horizontal lines to one another. The support and resistance levels create the highs and lows in the rectangular range.
A break in a trend forms the first top. The next three price fluctuations form a bottom, with the second top and bottom following afterward. The pattern has been confirmed when the price action remains still or rebounds from the lower boundary.
#2. Recognize Breakout of Rectangle Pattern
The bearish figure must break the lower level of the rectangle to confirm its existence, as it does in the case of a bull rectangle. In this scenario, traders will notice a signal on the chart indicating that the price may begin another bearish trend.
Traders looking for a bearish rectangle must find a breakout in the patterns higher level. This will indicate that the bullish trend is resuming.
#3. Get into the Trade
To join the trade, a broker should observe the direction of the rectangle breakout in the paused chart. After that, buy the asset in the case of a bullish rectangle trend and sell if you notice a bearish rectangle.
In a sell order, finding a break under support is vital in a sell order to validate the entry. However, before reaching this point, traders should look for a false breakout over the resistance line.
A false breakout is crucial because it prevents traders from establishing a short position in the current trend's direction and placing a stop-loss above the resistance level. At the same time, a resistance breakout trade may be trapped by a false breakout.
#4. Use Stop-Loss
Regardless of the trading formation chosen, most investors must exercise caution and not put themselves in a position where they hope for the best without preparing for an adverse scenario. Therefore, it's critical to place a stop-loss on a trading position if you are unsure whether the situation will improve or worsen.
Traders should place their stop-loss halfway between the resistance and support if they spot a rectangle breakout.
The trader is kept safe by doing this, and the maximum loss an investor can suffer from the trade will be limited to 50% of the pattern dimensions.
Stop-losses must be placed in the middle, following the purchase of a security on a rectangle breakout pattern, because there's a chance that the breakout will shake out before continuing the trend.
When investors stop at the breakout point, the smart money will buy more shares and then rise.
#5. Leave a Trade
Traders must adhere to certain rules and regulations when trading the rectangle pattern. For example, traders must stay in the trade for a price move that matches the degree of the pattern.
If we move the support and resistance lines down to the breakout point, we will notice a lot of room for adjustment. This implies that beginning at the breakout moment, we may adjust the length and direction in which the rectangle is plotted on the chart.
As the stop-loss is positioned midway between the range's boundaries, the target is twice as large as the stop. This results in a win-loss ratio of 2:1.
Best Forex Trading Course

Ezekiel Chew is a name that is well-known in the Forex trading industry. He is a highly successful Forex trader and trainer who has taught people how to trade Forex for many years. His Asia Forex Mentor program is one of the most popular and well-respected programs available, and a wealth of experience and success backs it.
The program is designed to teach people everything they need to know about Forex trading, from the basics to the advanced strategies that professional traders use. It is a comprehensive program covering all Forex trading aspects, and a highly experienced and successful trader teaches it.
The program is suitable for both beginner and experienced traders, and it has been designed to give people the best possible chance of success in Forex trading. It is a highly effective program backed by a wealth of experience and success. Signup Now!


Best Forex Brokers
Conclusion: Rectangle Pattern

The rectangle top chart pattern is popular among investors for a few reasons. The first and most important reason is that it's simple to spot on charts that depict price changes. When an indicator lags, it may be effectively utilized as a real-time tool—making the rectangle chart pattern essential in conjunction with other indicators and useful for technical analysis.
If you want attractive profits, you can use classical chart patterns, the best trading technique with many benefits. The rectangle formation is one of the oldest and continuation patterns, so it's a good complement to the broader trend.
The double-bottom reversal pattern is where the bulls and bears come into conflict. Within the rectangle chart pattern, a consolidation indicates neither side has control of the market.
In most cases, investors and traders prefer chart patterns since they know how the outcomes are obtained. The most common mistake traders make is to buy at the consolidation price and place their safe stop loss above or below it. The more clusters build up above and below the chart pattern, the higher the significance levels become for experienced investors who require access to these orders to execute important trades.
The rectangle patterns may be sold in a variety of markets. Traders that use the technique will gain experience identifying formations on your price chart and the ability to construct trading combinations based on their knowledge.
So, if you're a beginner, don't worry. The rectangle pattern is not difficult to understand. Remember that this strategy only works in a trending market—not a consolidating one. And, as with any technical analysis tool, the trader must use other indicators to confirm the breakout before entering into a trade.
Rectangle Pattern FAQs
Is Rectangle Pattern Reliable?
The answer to this question isn't as straightforward as you might think. The reliability of the rectangle pattern depends on several factors, such as the market you're trading in and the timeframe you're using.
Is the Rectangle Pattern bullish or bearish?
The rectangle pattern can be both bullish and bearish. The bearish pattern is created when the price action pauses after a downtrend and creates a bottom, while the bullish pattern is created when the price action pauses following an uptrend and creates a top.

