Want to jump straight to the answer? The best forex broker for traders is Avatrade
The #1 Forex Trading Course is Asia Forex Mentor
Investors use many indicators to decide the trends of financial markets, especially those involved in forex trading and the stock market. Investors use many popular momentum indicators to achieve their trading strategies, but some indicators are not so popular but are very effective, especially for trading volatile assets. One of the not-so-popular indicators is the Quantitative Qualitative Estimation (QQE), a smoother version of the Relative Strength Index (RSI) indicator because the QQE expands on RSI.
Quantitative Qualitative Estimation is a momentum-based indicator derived from the Relative Strength Index RSI, which is a smoother version of the Relative Strength Index because it further enlarges its concept of RSI by adding two volatility trailing stop lines.
These trailing stop lines comprise a slow and fast-moving average true range (ATR). Therefore, the basics of the Quantitative Qualitative Estimation (QQE) indicator are observed for interaction for both trailing stop lines.
For this article, we have Ezekiel Chew, a world-renowned and seasoned forex mentor and expert, to further explain the Quantitative Qualitative Estimation indicator concept. Scroll down the paragraphs below to understand the Quantitative Qualitative Estimation (QQE) concept and apply the QQE indicator to your trading.
What is Quantitative Qualitative Estimation

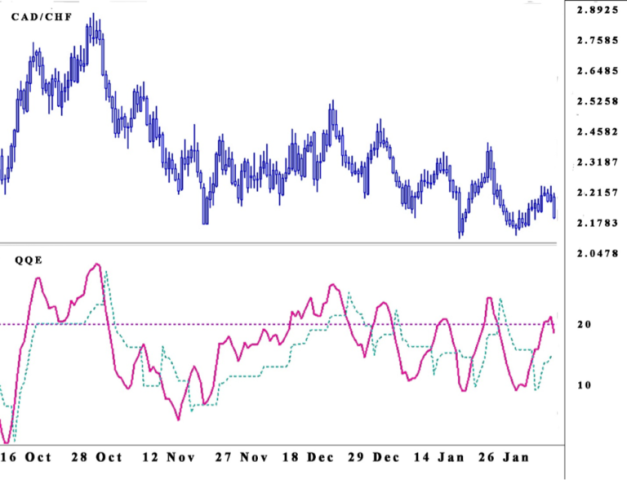
Quantitative Qualitative Estimation QQE indicator is a momentum-based indicator that is a smoother version of the Relative Strength Index RSI used to decide market trends and sideways. In addition, the Quantitative Qualitative Estimation has two additional volatility trailing stop lines formed from the average true range ATR lines of the fast and slow-moving average.
The Quantitative Qualitative Estimation indicator works by observing the interaction for both the fast and the slow-moving trailing stop lines. The QQE indicator is not prone to short-term volatility because the average true range ATR lines are smoothed; hence, more volatile assets like forex and stocks are analyzed with the QQE indicator.
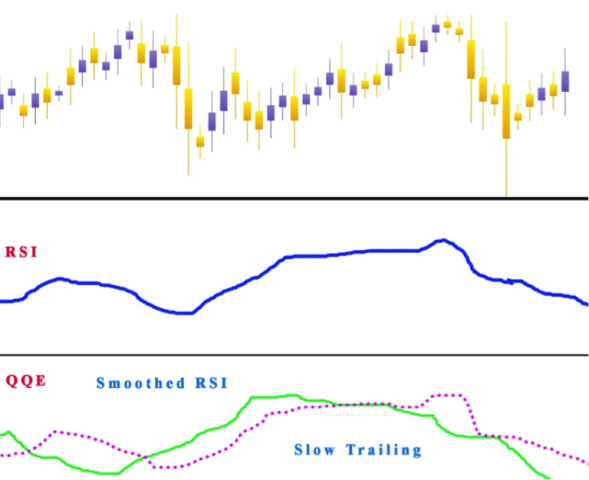
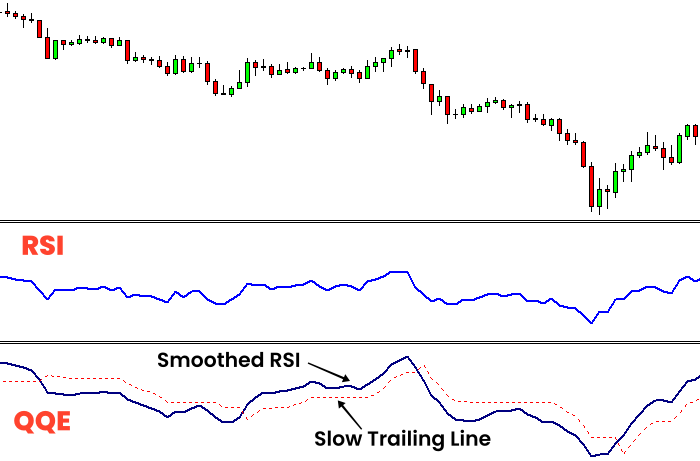
Just like the Relative Strength Index RSI indicator, the Quantitative Qualitative Estimation QQE indicator is a smoother version of the Relative Strength Index, and unlike it, the QQE indicator contains an additional line- the slow trailing line.
How to Calculate QQE Indicator
QQE indicators, just like other indicators, are created by mathematical equations and formulas, which can either be simple or complex. Recently, software and applications have been developed to do all the calculations and monitoring of trade signals.
However, it is always best for investors and traders to understand the methods and how the formulas are calculated to know the key factors that determine and influence the indicator.
To calculate the QQE indicator, follow the procedures below;
- Take an estimate of the 14-period Relative Strength Index RSI
- Get the flattened Relative Strength Index9 RSI by using the 5-period Exponential Moving Average EMA of the Relative Strength Index RSI the absolute value of the bar-to-bar change in the smoother version of the RSI
- Apply a 27-period Exponential Moving Line EMA to the Relative Strength Index RSI average
- Get the slow trailing line by multiplying the previous step's results by 4.236
Quantitative Qualitative Estimation Explained
Having known that the Quantitative Qualitative Estimation is a smoother version of the Relative Strength Index RSI, one of the most important factors of the Quantitative Qualitative Estimation is the smoothing factor. The smoothing factor is the moving average period used in smoothing the Relative Strength Index indicator.
While using the QQE indicator for signals, one of the ways it produces signals is the divergences between the QQE and the price in an attempt to monitor the potential combinations for a trend reversal or trend continuation. There are two types of divergences, bullish divergence, and bearish divergence.
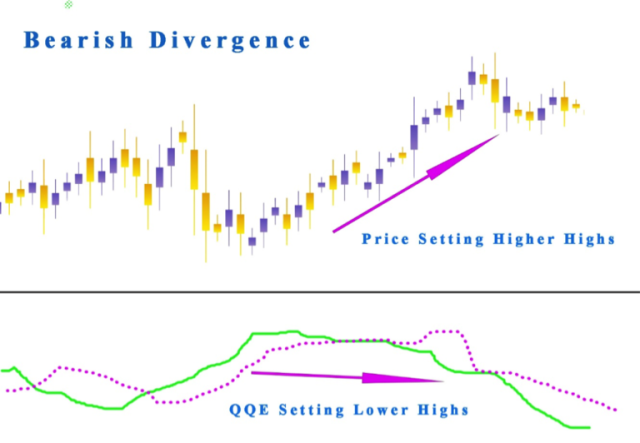
The bearish divergence occurs when the prices reach higher highs and the QQE indicator creates lower highs, while the bullish divergence occurs when the prices reach lower lows and the QQE indicator creates higher lows.
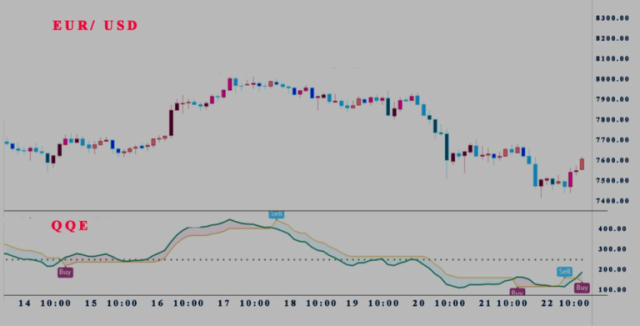
Another way to use the QQE indicator signals for trading is when a blue line is displayed that intersects the fifty level and causes a line break out. It is advisable to monitor the trend signals by placing a purchase signal immediately after the blue line intersects in an upward movement when the two lines occur below the fifty level.
Also, investors can monitor the trend signals by placing a sell signal when the cross is in a downward direction, and the two lines are below the fifty level.
Interpretation of QQE Signals
One very important essence of the QQE indicator is to indicate overbought and oversold conditions; overbought occurs if the QQE indicator is above the seventy level, while oversold occurs if the QQE indicator is below the thirty level. When a QQE indicator occurs below the thirty level, it might be a long option, and when a QQE indicator occurs below the seventy level, it might be a short option.
When Smoothed RSI crosses the line
Smoothed RSI crosses either the fast or slow average true range trailing lines such that if the RSI occurs below the fast or slow average true range railing lines, it indicates a sell option. Conversely, the RSI above the fast or slow average true range railing lines indicates a buy option.
The Average True Range ATR Trailing Line Crossover
If the fast ATR trailing line falls below the slow-moving average true range trailing line, it indicates a short setup, while if the fast ATR trailing line falls above the slow-moving average true range trailing line, it indicates a long setup.
The RSI Cross of the Fifty Levels
If the RSI falls below the fifty level, it indicates a short setup for selling, while if the RSI falls above the fifty level, it indicates a long setup for purchase.
Divergences that occur between the price action and the QQE indicator
In this case, there are two potential divergence combinations: the hidden and the regular. Hidden divergence signals the continuation of the trend, while regular divergence signals the reversal of the trend.
The hidden type of divergence for the bullish trend occurs if price action starts forming lower lows and the technical instrument shows higher highs, while the bearish trend occurs if the price action starts forming higher lows and the technical instrument shows lower lows.
The regular type of divergence for the bullish trend occurs if price action forms lower lows while the indicator forms higher lows, but for the bearish trend, it occurs if price action forms higher highs while the indicator forms lower highs.
How is the QQE Indicator used
Since the Qualitative Quantitative Estimation shares similar characteristics with the Relative Strength Index (RSI) indicator being a smoothed version, both indicators have similar functions. The QQE indicator can achieve the best results when positioned on a higher timeframe trend. To make profitable trades through the QQE indicator, it is best to buy at support levels and sell at resistance levels.
Some of the ways the QQE indicator is used include:
For momentum divergence and spot price
The market's momentum frequently drives the price action; hence, the divergence between the price and the Qualitative Quantitative Estimation can help to indicate future trend reversals and possible predictions.
For example, during the bearish divergence, the QQE indicator creates lower highs while the price action creates higher highs, implying a potential bearish trend reversal. For the bullish divergence, the QQE indicator creates higher lows, while the price action creates lower lows, implying a potential bullish trend reversal.
For Trend detection of the market
Some values are represented on the QQE indicator, which indicates different trend signals. For example, the values below the fifty level indicate a bearish market, while those above the fifty level indicate a bullish market.
Also, if the values are below fifty, traders can perform short trades, while if the values are above fifty, traders can perform long trades.
To locate overbought and oversold conditions
The most common method of using the QQE indicator is to locate both overbought and oversold conditions, such that QQE values above seventy signal overbought conditions while QQE values below thirty signal oversold conditions.
Also, short trades can occur if the QQE indicator falls under the seventy line, while long trades can occur if the QQE indicator falls above the thirty lines. Summarily, the QQE line reflects overbought or oversold conditions.
Best Forex Trading Course

Asia Forex Mentor offers the best forex trading education in Asia. The course is set up so that you can earn money while learning. You'll be able to trade forex profitably with a skilled trader's help. In Singapore and other sites worldwide, tens of thousands of people from the United States, the United Kingdom, and other Asian countries have been taught.
Ezekiel Chew's teaching method is founded on the principle of return on investment, which states that if you invest $1, you will gain $3. It's not about zany strategies or elaborate procedures. Professional traders and financial organizations use his authorized system. He is the driving force behind the growth of various companies, including DBP, the Philippines' second-largest state-owned corporation.
Due to his strategy's effectiveness, many full-time traders have joined the program with little to no prior trading experience and emerged successful.


Best Forex Broker
Conclusion: Quantitative Qualitative Estimation
Although the Qualitative Quantitative Estimation is a momentum-based indicator used on trading platforms, it is not a commonly used indicator because of its seemingly complex formula.
The Qualitative Quantitative Estimation is like a smoother version of the popular Relative Strength Index RSI indicator, which implies that they almost serve the same function because they follow the price action, except that the QQE indicator has additional trailing stop lines.
The QQE indicator works like the RSI, but it is unique in that it is very versatile because of the two trailing stop lines it forms, the smoothed RSI and the slow trailing line; traders can use it in any market type, forex markets inclusive. The QQE also helps investors by providing essential data that can be used to achieve their trading strategies.
To wrap it up, the Qualitative Quantitative Estimation indicator is not a standalone indicator; this implies that it should be used alongside other indicators to confirm the results received to ensure that, as an investor, you're making the right trading investment.
I hope you enjoyed this article, and you can now apply the QQE indicator to your trading techniques to whatever market type you choose and start making profitable trades.
Quantitative Qualitative Estimation FAQs
How is QQE calculated?
As earlier mentioned, the QQE calculations and formulas are a bit complex. Still, it is not something that cannot be understood, provided the basics of the QQE are properly understood.
The Qualitative Quantitative Estimation calculation is based on the slow trailing lines and fast-trailing lines located by estimating the average true range ATR lines of the smoothed RSI over a certain period. The smoothed version of the ATR of the RSI is then multiplied by the fast and slow average true range ATR to get the final trailing levels.
What is QQE?
The Quantitative Qualitative Estimation (QQE) indicator is a momentum-based indicator used to detect market and determine trend and sideways. In addition, the Qualitative Quantitative Estimation is a smoother version of the Relative Strength Index RSI because it has two additional trailing stop lines.


