

Want to jump straight to the answer? The best forex broker for traders is Avatrade
The #1 Forex Trading Course is Asia Forex Mentor
Forex reversal patterns are one extra tool that every trader needs to have in their arsenal. They come in different forms but they all have one single goal-to tell traders when a trend reversal is about to occur.
Forex reversal patterns should be used with other forms of technical analysis such as support and resistance.
To help you understand everything you need to know about reversal patterns, we've got Ezekiel Chew, a world-class forex trader who has also trained traders from all over the world including banks and institutions to share with us the basics of reversal patterns.
Forex Reversal Patterns: What is Forex Reversal Patterns
You've probably heard this one- the trend is your friend. to be a successful forex trader you will need to study the chart formation and search out a reversal chart pattern such as an inverse head. This could be a bullish reversal pattern or a bearish reversal pattern.
You also need to learn how to identify continuation patterns.
Being able to identify such patterns will give a trader important information which helps him or her adapt to market movements. There are many other different types of chart patterns including candlestick patterns, double top pattern, and head and shoulders patterns, to mention a few.
Forex chart patterns are shapes in price that occur regularly and provide consistent results. A chart pattern gives traders an idea of what may happen in the next move. As chart patterns are fairly regular, a trader needs to be able to identify these chart patterns to make wise trading decisions.
Using a chart pattern in your analysis can significantly improve trading results. In fact, chart patterns are a significant part of technical analysis. forex chart patterns can be divided broadly into two categories:
- Forex reversal patterns
- Continuation patterns
The most popular of these is the reversal patterns. The reversal chart pattern can give insight to the forex traders on the best point to get out of an existing trend.
The opposite is also true. A reversal pattern can offer the trader valuable information on when to join a developing trend. You can see how used together with technical analysis tools such as a trendline how reversal patterns can be a powerful trading ally.
That said, continuation patterns can tell the trader when is the right time to scale up and increase profits. Following the trend is always a good choice for the trader, but incorporating patterns can improve trading significantly.
How to Identify Trend Reversal In Forex

The price of a trading instrument tends to change in the opposite direction after certain candlestick patterns have formed. Savvy traders, therefore, learn to look out for these patterns. In fact, a lot of traders will use patterns such as the double bottom pattern or double top pattern to predict a change in the direction of prices.
The candlestick patterns used with patterns such as the head and shoulders pattern tend to offer some of the best entry points. Traders can use them to find the beginnings of a bearish trend for example and decide whether to enter or exit the market.
Keep in mind that the main purpose of such patterns is to show an entry point and will not show when to take profits. To determine when to take profits, forex traders will employ a good risk-reward ratio.
There are plenty of tools that have been designed to identify reversal patterns. However, it is always best to find such patterns on your own.


What is Candle Stick Chart
The candlestick pattern has become the norm in all financial market charts. But its origins are quite humble. It is the Japanese that started using the candlestick pattern to track price movement when trading rice.
The rice traders found that the emotions of buyers and sellers also had a big impact on the supply and demand and therefore the price movement.
Because of this, the traders considered emotions as a major factor in determining price movement.
Later the candlestick pattern was brought to the west by a guy named Steve Nison. A candlestick chart pattern can, therefore, show how human emotions influence the price.
12 Best Candlestick Reversal Patterns
#1. Hammer
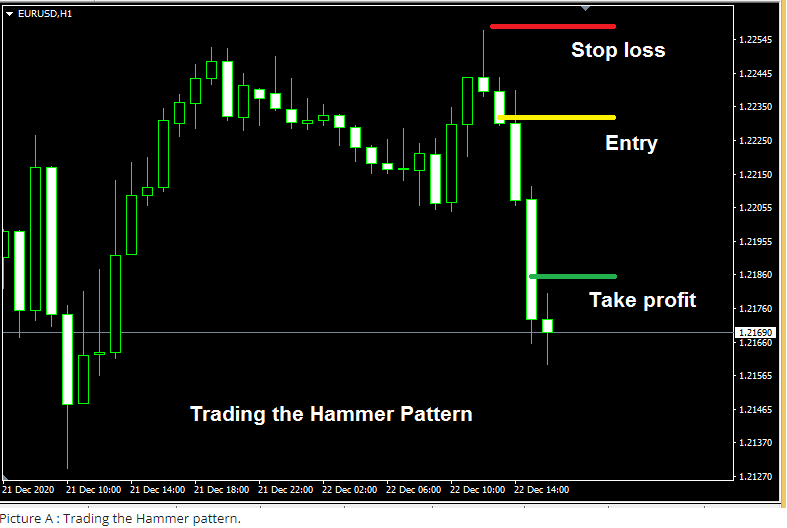
This pattern is one of the most common and most popular candlestick patterns. It is characterized by having a long tail and a small body. Very often the length of the wick will be twice that of the body.
After seeing the hammer candlestick, you will need to wait for the following candle to get a confirmation. If it closes in the same direction as the hammer candlestick then it is a good confirmation of the beginning of an upward trend or a downward trend.
A trader will then enter a trade at the end of the confirmation candle and places his or her stop loss at the end of the wick. One thing to keep in mind is that if the hammer occurs during periods of consolidation or low volatility, then it is less effective and reliable.
#2. Hanging Man
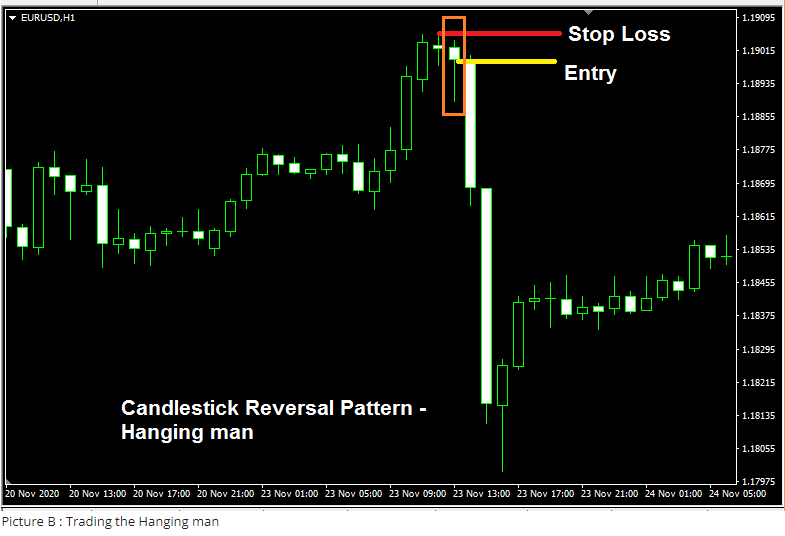
This pattern looks somewhat similar to the hammer pattern. The main difference is that the hanging man occurs during an uptrend. It is also known as a shooting star pattern.
The hanging man also has a small body relative to the size of the wick and the body may be three times smaller than the wick.
During an uptrend, the hanging man appears with a long wick to the downside. This shows that sellers are now entering the market and overpowering the buyers. If the next candle closes lower than the hanging man candle, then this is a good sign that sellers have overpowered the buyers.
It's also at this point where the trader can enter the market while placing the stop loss order above the hanging man candle.
#3. Bullish Engulfing
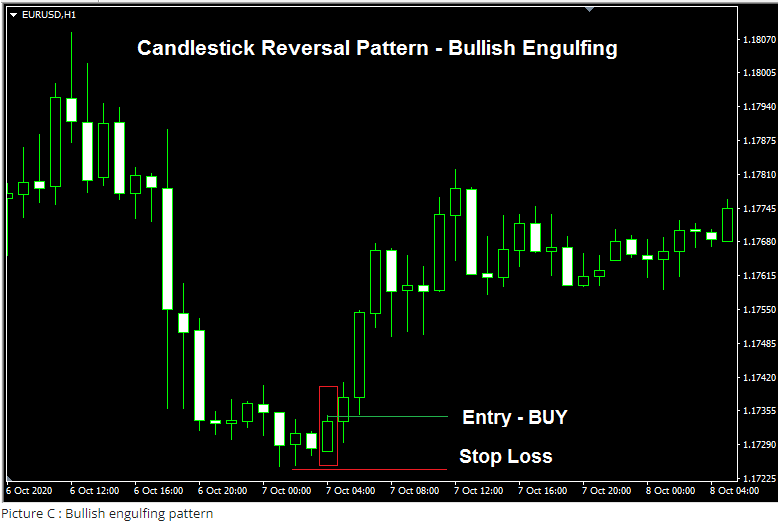
The bullish engulfing candlestick pattern is one of the most common. Due to the frequency of its occurrence, it can offer more trading opportunities. Whether you are a swing trader or a day trader, bullish engulfing can work for any trading strategy and trading system.
It is called a bullish engulfing pattern because the body of the candle engulfs the previous sell candle. This offers the trader insight into the market sentiment. During a falling market, it is the sellers that are in control of the market. When a bullish engulfing candle occurs, this shows that the buyers have started streaming in and are now trying to control the trend.
A trader can enter the market as soon as the bullish engulfing pattern has closed. A stop-loss order will be placed at the previous low.
#4. Bearish Engulfing
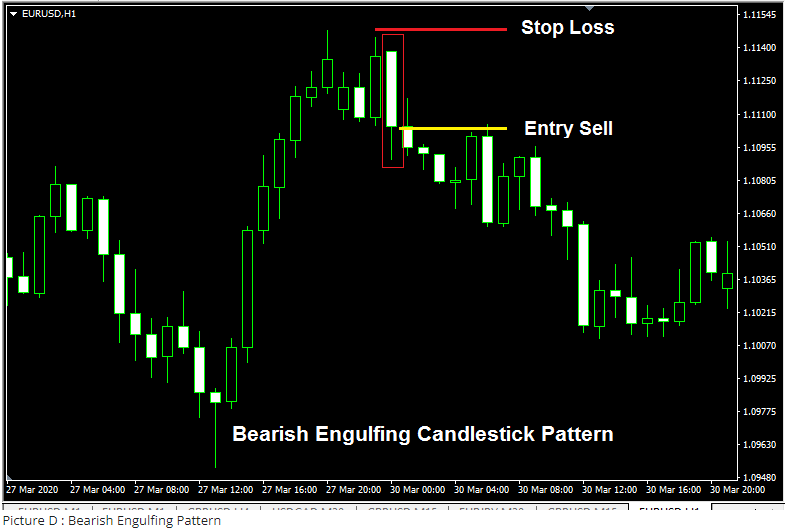
The bearish engulfing pattern is the opposite of the bullish engulfing. It occurs after a bullish candle. the bearish engulfing then completely engulfs the previous bullish candle.
The bearish engulfing pattern can give insight to traders on the sentiment in the market. When price action starts to stall, followed by a bearish engulfing, this shows traders that there could be a possible reversal.
It is only an engulfing pattern when it opens and closes above and below the body of the previous candle. Traders can enter the market at the close of the bearish engulfing candle and place their stop loss at the last swing high.
#5. Bearish Harami
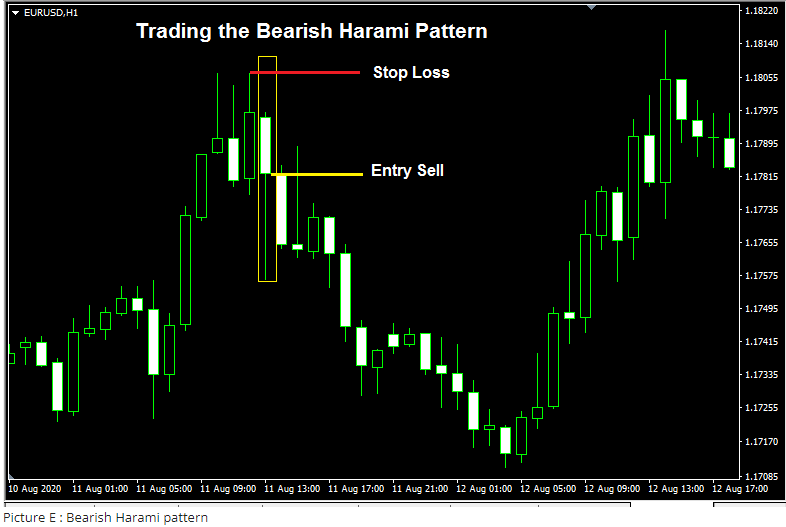
This is also one of the most common candlestick patterns in the financial markets and also one of the most important reversal patterns. When it occurs it is an indication of changing sentiments and may indicate a bearish reversal. A harami candle will open lower than the previous bull candle and also closes higher than it.
One thing to always note is that the harami candle and the previous candle will be opposite candles. This simply means that if it's a bearish harami candle the candle behind it should be an up candle.
Traders can enter the market after the close and formation of the harami candle. The Stop-loss order will be placed behind the last swing high.
The harami candle can form a Doji. In this case, it will be referred to as a bearish doji harami candlestick pattern.
#6. Bullish Harami
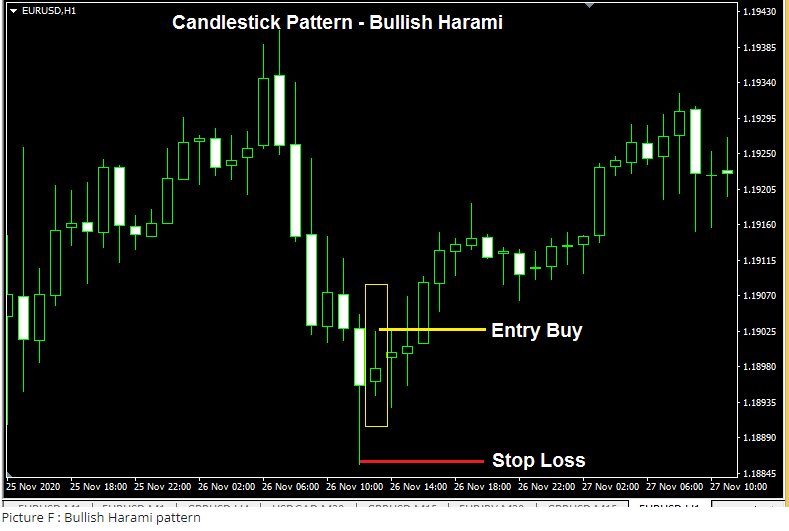
The bullish harami forms in the opposite fashion of the bearish harami. Traders will look for this bearish pattern when there is a downtrend. Its occurrence signifies a potential reversal of a trend.
The bullish harami pattern will open higher than the previous bearish candle and close lower than it. Sometimes the bullish harami pattern may form a Doji which is then referred to as a bullish Doji harami pattern.
Traders will look to enter the market after the formation and close of the bullish harami pattern. The stop loss will be placed at the previous swing low.
#7. Three White Soldiers
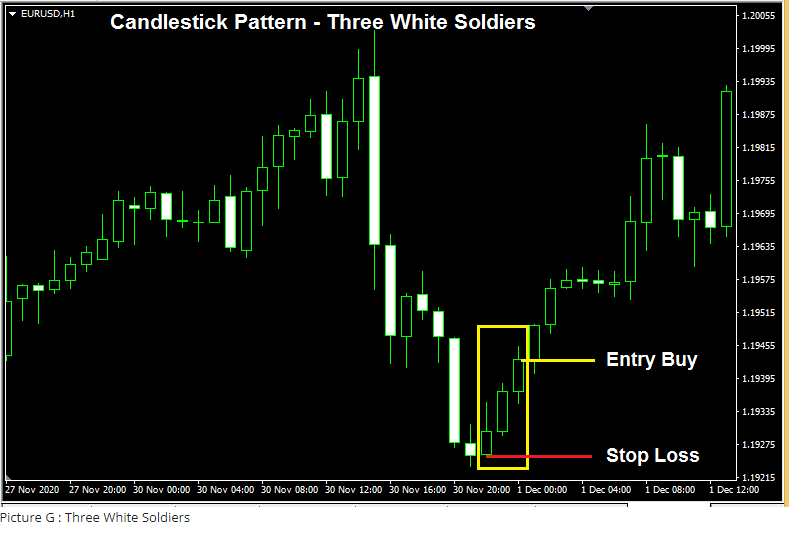
One of the most reliable reversal trading signals comes after the formation of the three white soldiers. These offer a great point to enter into a bullish trade. These are three consecutive bullish candles and are a good indication of increasing buyer strength.
Trades will enter the market at the closing price of the third bullish candle. Stop-loss order will be placed at the previous wing low.
#8. Three Black Crows
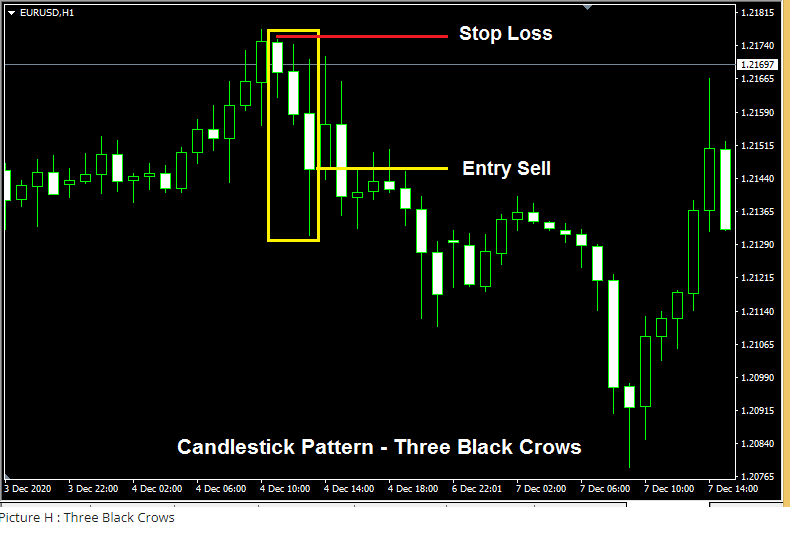
The three black crows refer to three consecutive bearish candles that could be used reliably as a bearish reversal pattern. They are the upside-down version of the three white soldiers' pattern.
The pattern forms after three consecutive bearish candles.
The formation of the three black crows is a good indication that the sellers are taking over the market. Traders will look to enter the mart after the formation of the third bearish candle and the stop loss will be placed at the last swing high.
#9. Morning Star Doji
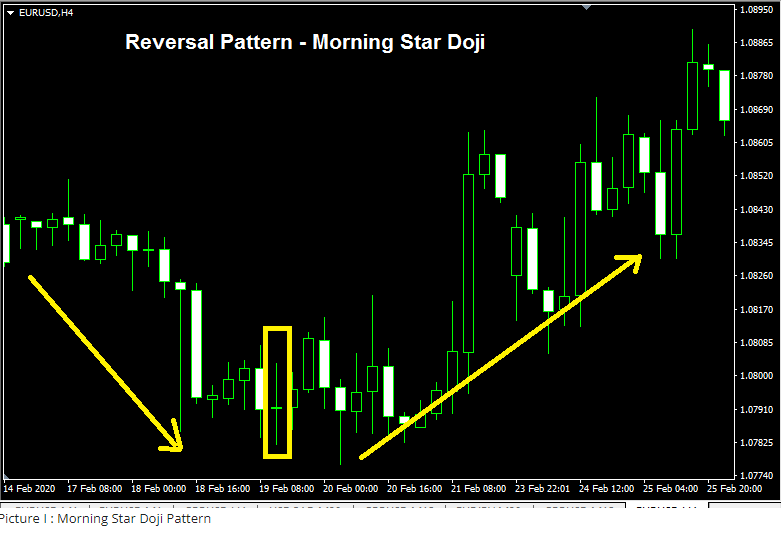
The morning star Doji candlestick pattern occurs at the end of a bearish trend and is often used by traders to signify a bullish reversal. As the name implies, the shape of this price pattern is a Doji “+”
When a Doji occurs this shows that there is indecision between buyers and sellers. When a Doji forms during periods of low volatility then this should not be considered a reliable indicator of entering the market.
The best Doji patterns occur during trending markets. There are different types of Doji patterns such as the dragonfly Doji, log-legged Doji, and the gravestone Doji.
#10. Evening Star Doji
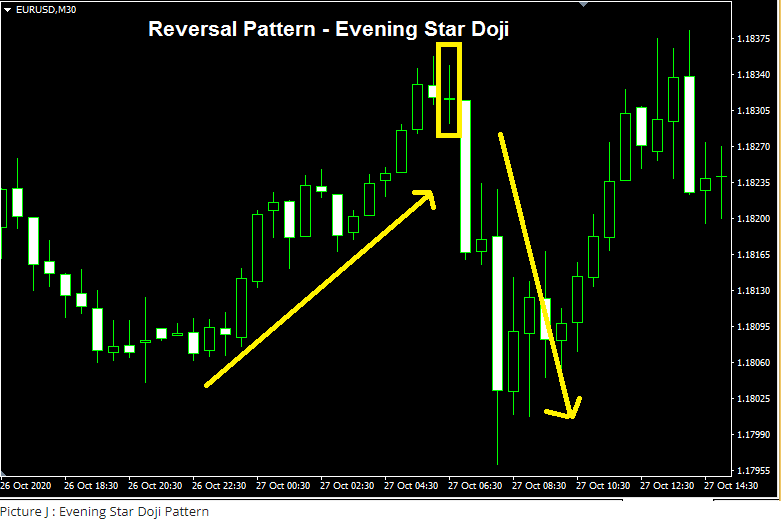
The evening star Doji occurs during an uptrend and signifies indecision between buyers and sellers. It can be a good sign that the trend has lost momentum and is now about to reverse.
Once traders spot a Doji they will wait for the following candle to confirm sentiment. In the case of an evening star if the following candle is bearish, then this would confirm a bearish reversal.
#11. Morning Star
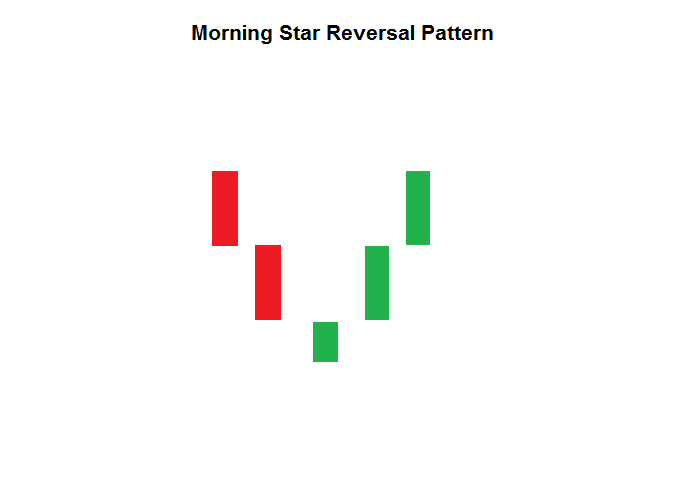
This reversal pattern works in the same way as the morning star Doji pattern. However, instead of having a Doji candle, the morning star pattern has a regular candle. The reversal candle should have the opposite color or movement to the prevailing trend.
It is the following candle that gives traders a confirmation. Traders will enter at the close of the following candle and place their stop loss at the previous swing low.
#12. Evening Star
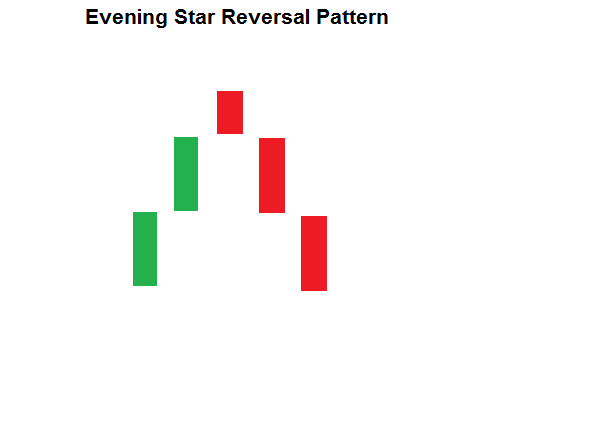
The evening star pattern is the exact opposite of the morning star.
It occurs after an uptrend and signifies that prices are now looking to change to bearish momentum.
Once you see a candle that is in a bearish move, wait for the confirmation candle. If it's also in a bearish move you should then enter the trade and place the stop loss at the previous wing high.
Limitations
Candlestick patterns are a great way to find out about the current market sentiment.
However they should never be used in isolation, they must be confirmed with relevant price action and other technical analysis tools to be able to give consistent results.
Some patterns will need more than one candlestick to be able to provide a confirmation entry. This is something that affects new traders as they often don't have the patience to wait for the candlestick pattern to form.
However, it is always a good idea to include a chart pattern such as the sushi roll reversal pattern together with the candlestick analysis for the best results.
Some candlestick patterns also have a higher success rate than others. That said, all candlestick patterns tend to be more accurate in higher timeframes. They can however be applied to any price chart and in all time frames.
Best Forex Brokers
Best Forex Trading Course

If you want to learn candlestick patterns and trade forex successfully, then you need the Asia Forex Mentor. This amazing course was developed by the legendary Ezekiel Chew.
He has been in the forex market and trained many successful forex traders from different backgrounds from individual retail traders to banks and financial institutions. So you know you are dealing with a proven course that has credible results.
The Asia Forex Mentor One Core Program is divided into 5 sections. Each section seamlessly progresses into the next to turn you into a competent and capable trader. It is suitable for any level trader from beginner to advanced. With the Asia Forex Mentor One core Program, you also get access to Ezekiel Chew's live trading so you can see firsthand how he executes trades.
Conclusion

Being able to read the market sentiment can prove a highly profitable skill. Candlestick patterns help a trader do this.
Having a thorough understanding of candlestick patterns can therefore give a trader an edge.
That said, candlestick patterns should be used together with other technical analysis tools to make for a more reliable trading signal.
Candlestick patterns should therefore be a part of a trader's strategy and system to help confirm current price action.
Forex Reversal Patterns FAQs
What is the most powerful reversal pattern?
The head and shoulders pattern, together with the double bottom pattern are considered one of the most powerful reversal patterns. It features three peaks. The middle peak is usually higher than the other two which tend to be of the same height.
This results in a head and shoulders shape. This is also one of the most common reversal patterns.
The head and shoulders pattern can occur at the top of a bullish trend or at the bottom of a bearish trend.
In the latter case, it is called an inversed head and shoulders pattern.
How do I find a forex reversal pattern?
You can spot forex reversal patterns using one of the simplest technical analysis tools -the trend line. A trend line is often used to connect intermediate highs or lows.
When price breaks through trend lines, this could show that the trend has been broken and is now in a reversal.
That's said, the trend line should also be used with other technical analysis indicators or tools including candlestick patterns to validate the price reversal.
How many types of reversal patterns are there?
Reversal patterns can mainly be divided into two categories. These are the bearish reversal patterns and the bullish reversal patterns.
The bullish reversal pattern is used to predict bullish reversal and signified that a prevailing bearish trend is going to turn to the upper side.
A bearish reversal pattern indicates that a prevailing bullish trend has reached a point of a reversal towards the downside.


