
Want to jump straight to the answer? The best forex broker for traders is Avatrade
The #1 Forex Trading Course is Asia Forex Mentor
Mastering forex shapes or patterns is a strategy established traders rely on to trade successfully. The occurrence of patterns is an easier way for forex traders to decipher what markets are saying at any time frame. Price movements are random. But patterns make it easier for traders to speculate on future price movements. And that also borrows from the past behavior of prices for a currency pair.
Ezekiel Chew, the trainer behind the Best Fx trading course, shows traders how to comfortably trade with the support and resistance indicator in finer detail. He trains and mentors traders on how to accurately plot the dynamic positions of support and resistance, which blend well with pattern formations to enhance your trading masterly into a profitable journey.
The mentor shows traders to move away from the notion that support and resistance are straight lines. Hoe shows traders how to plot the dynamic support and resistance regions. In this particular write-up, Asia Forex Mentor, an established and leading trainer with over a decade of experience, will guide us to the next levels with FX patterns.
By the end of this write-up, you should be able to have a basic grasp of how patterns occur in price action. Next, you'll see how traders approach the market with high probability setups concerning each forex pattern.
Forex Reversal Patterns: What is Forex Patterns

One of the best ways to become a successful forex Trader is trading along with a trend. The discipline involves carefully studying chart formations to identify the unique shapes in time. It is, therefore, a discipline that takes time to master, and the results get better if a trader is patient enough to wait for adequate pattern formation. A chart pattern comes with a high probability of profitable trading results from early identification and open positions at just the right time.
Forex formations are simply unique formations of shapes formed by candlesticks. And the good thing is that they occur repetitively. Careful analysis of price over time combined with the knowledge of distinct pattern formations gives reasonable assurance of where the prices are headed within a particular time frame. Therefore, traders take the opportunity early enough and prepare to act quickly but carefully.
Good trading combines the knowledge of pattern formations and technical analysis where traders use various indicators in FX trading patterns are categorized into two:
- One is the reversal or reversing patterns
- Two is the trend continuation shapes or patterns
Best trading results come from traders who rely on the reversal patterns because they get the best opportunities to exit with profits. Also, continuation shapes/patterns give Traders opportunities to increase their positions in the direction of a trend.
Forex Chart Patterns

According to the Asia Forex Mentor, it takes patience to do a market analysis and identify good entry opportunities. The keyword here is patience, and combining the knowledge in chart patterns gives a trader the confidence to open positions with the highest probability of winning or else exit with a minimal capital loss. FX patterns are not a too sure bullet in trading forex. However, they increase the confidence of a trader while approaching market opportunities.
Forex Continuation Chart Patterns

Forex continuation shapes/patterns signal that the current trend is likely to remain in the future time frames. The occurrence of continuation patterns of cars in the middle of a current trend. Whenever a continuation pattern shows up, it indicates that the prices will remain in the long-run trend within longer time frames. Examples of continuation patterns include the payments, a rising wedge, and a falling wedge.
Reversal Chart Patterns
A forex reversal chart pattern occurs in the current trends' end – where the momentum fails in the forex market. A reversal pattern shows that prices are highly likely to change direction in future time frames. Therefore, essentially it shows mounting pressures from either the buyers or sellers.
Where bullish trends reverse, markets get into a distribution stage- where sellers push prices lower. The opposite is true; at the extreme of a bearish trend, bulls step in at the market accumulation stages and push prices higher into future timeframes.
Bullish Forex Patterns
Bullish FX patterns appear in markets where prices keep rising or dominant uptrends. Traders must keep in mind the main trend while looking for pullbacks and good entry points to ensure the risk-reward ratio gives them good returns.
The essential point here is the master and confidence of the forex market formations. Overall, traders joining into bullish trades have to be certain the market conditions will not remain favorable intermittently. One more important note is that bullish FX patterns show up in markets that are in accumulation and ascent stages.
Bearish Forex Formation/Patterns
Bearish FX patterns dominate where prices are mainly on a downtrend. Experienced traders classify down-trending markets to be within either distribution or decedent stages. Bearish patterns show in the form of definite pullbacks, but prices keep disintegrating into lower levels over subsequent timeframes and within a long-term downtrend.
As the rule of thumb holds, traders spot entry points with low-risk and high reward ratios. In the long run, traders must remember that bearish trends reverse at some extreme points. Therefore, the key points are to avoid a huge pullback on an ultimate reversal into bullish narratives.
Forex Patterns
#1. Head and Shoulders Chart Pattern
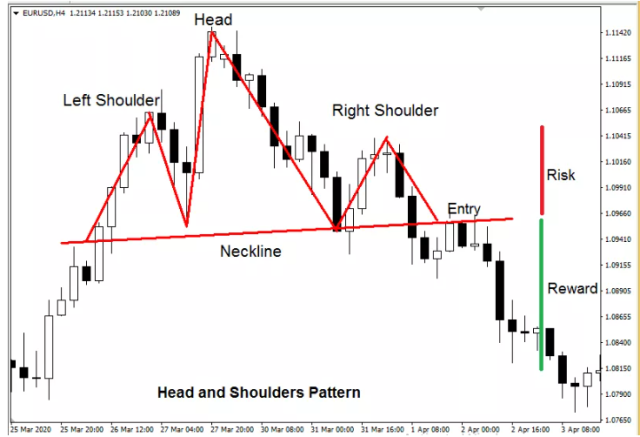
As a forex trader, the Head plus Shoulders forex chart pattern is the most important forex pattern. And as the name suggests, it comprises two parks, each on the sides of the middle peak- being the head. Of course, the peaks on either side are the respective shoulders.
It's important to grasp the exact position of the neckline – which is the trend line that sits at the base of all the peaks. With the head plus shoulders formation, traders target to make entries at the neckline break. The rule of thumb is to work with a risk-reward ratio of 1:2, where 1 is the height of the right shoulder.
#2. Inverted Head and Shoulders Chart Pattern
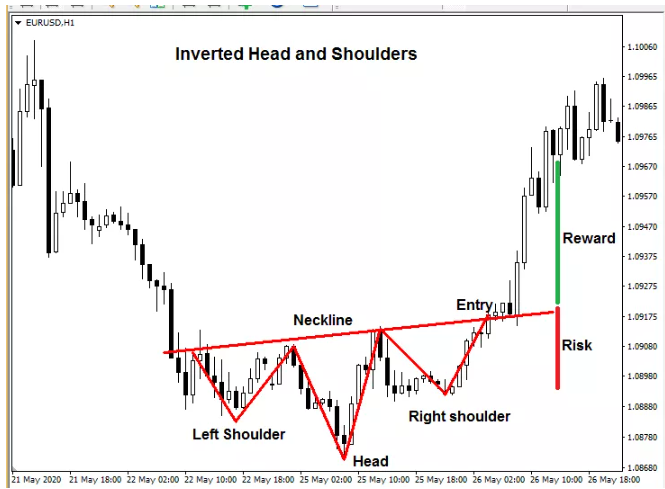
Inverted head plus shoulders forex chart patterns are the opposite of the normal head and shoulder patterns. It essentially shows bullish reversal signals. If you are a new FX trader, you can trade following this pattern easily and make profits if you identify it earlier enough, plus strike open a position at the correct entry position.
The key point to note is that the inverse head & shoulders chart patterns also work with a risk to reward ratio of 1:2. And the best trade entry position is when prices break the neckline and into a bullish trend. Target take profits are mostly within areas of previous resistance.
#3. Double Top Chart Pattern
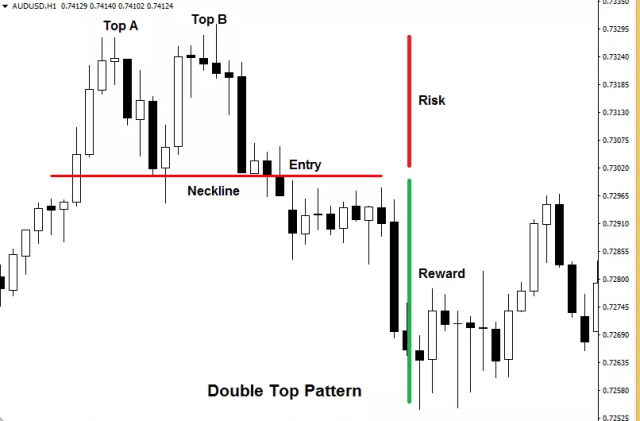
The double tops chart pattern is one of the bearish reversal patterns. After a long bullish trend, prices will navigate an M-shape before the eventual trend breaks or turns bearish. In other words, prices hit two peaks before the trend turns bearish. Also, the key with the double top pattern is spotting where the base or neckline sits – right at the base of the letter M- formation.
Trading the double top requires a trader to monitor the formation and enter trades when the prices break the neckline. Of course, the formation completes with heavy bearish movements. However, traders should best work with a risk-reward ratio of 1:2 by placing take profit positions twice the swing-high of the pattern formation.
#4. Double Bottom Chart Patterns
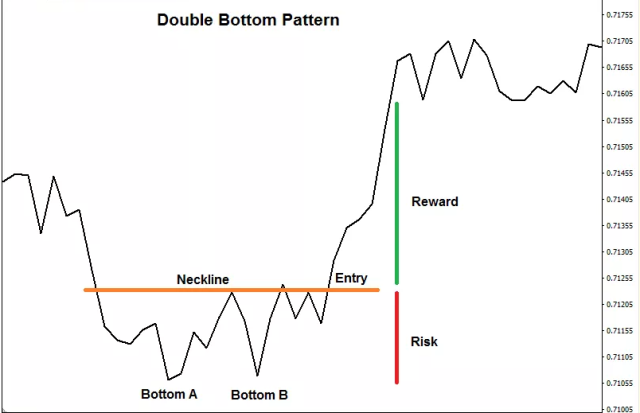
The double bottom pattern formation indicates tendencies of prices to reverse into bullish narratives/ trends. Prices navigate a letter W – formation before eventually turning bullish- after symmetrical triangle two. Trade this pattern as you would for a double top – working carefully with a neckline and risk to reward ratio set to 1:2.
Place the stops within the swing-low of the formation while booking your profits at double the pips you are risking. However, being a bullish reversal formation, you may ride a profitable trade to as far feasible as the bullish trend sustains. If circumstances allow, and if the bullish trend favors you, it may help to add a few more trades and reap from them as long as the trend remains. So, it's not a must to exit at a position when prices swing to double your reward targets. And essentially, that's how patience can pay back so amazingly with few trades at maximum rewards.
#5. Triple Top Chart Patterns
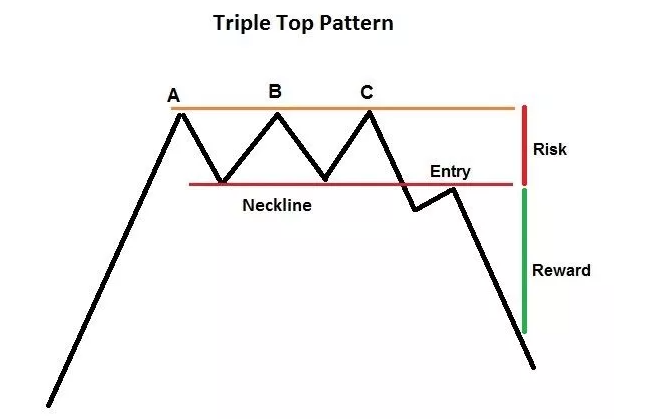
Triple tops are a bearish FX reversal pattern. It’s almost similar to the double top. However, in this case, prices loop once more for a third time before eventually breaking down into bearish narratives. And this is where traders require patience – because it’s almost a double top, but prices still end up in bearish zones.
Trading can be fun if one has the patience to observe pattern formation and jump in at the right moments. Essentially a trader looking for a triple-top pattern is not in a hurry to chase the upward swings of the bullish trend. Of course, more monitoring should be at the top 3, but it all counts on patience and careful entry. There's usually more guarantee as prices must swing down at some points into the future time frames after a strong bullish swing.
#6. Triple Bottom Chart Patterns
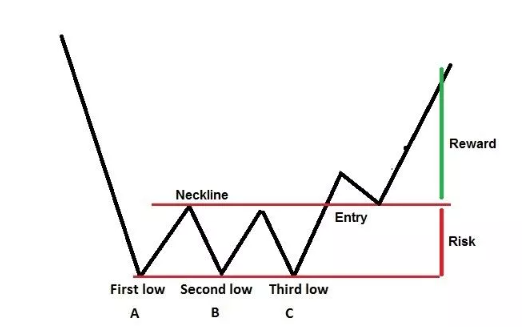
Triple bottom patterns are traded as the exact opposite of the triple top. The point to observe here is the attempts of price to resist further bearish signals– and essentially, the prices break into bullish at the third attempt(3 symmetrical triangles) along with the price charts.
The ultimate point of focus with triple bottoms is the breakage of prices. And that's from a low point, past the necklines – price rises may proceed into new bullish trends which invalidate a falling market.
#7. Rounded Top Chart Patterns
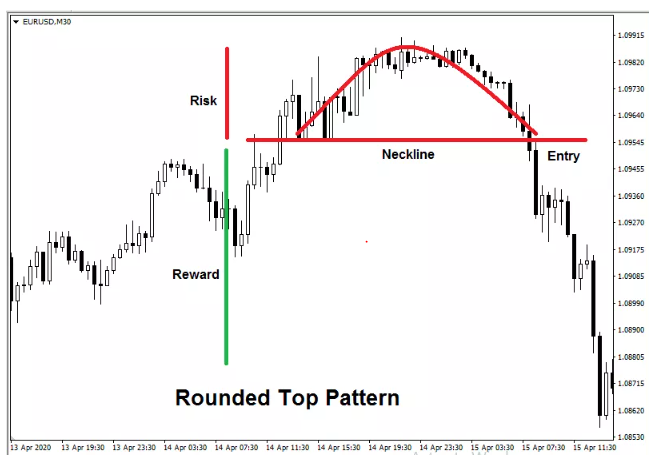
In forex, the rounded top patterns are a bearish reversal signal. And the pattern appears at the swing highs of a long bullish trend. It’s an indicator that the bulls in the market are running out of steam, hence unable to sustain the extensive bullish trend in price charts.
A rounded top should not be confused with a double top. And essentially, taking caution to identify the right shape or pattern gives you a better hold of your trading. And one best way is to get a clear and correctly fitting neckline. Other than missing the identifiable tops for a double or a triple, the rounded top has a neckline that sits right at the top of a previous swing high.
#8. Rounded Bottom Chart Patterns
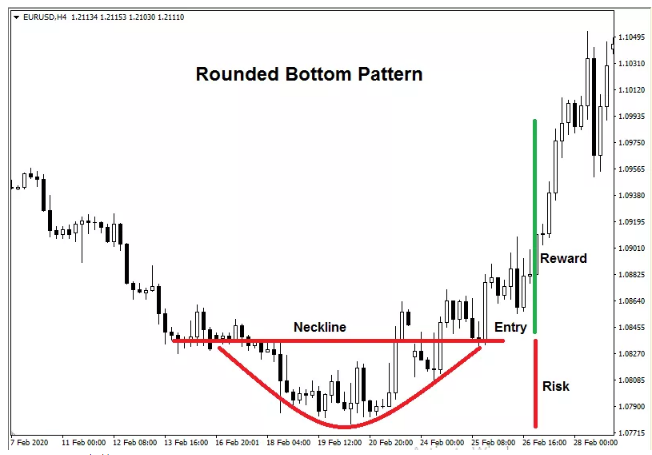
Rounded bottoms are signals of a potential bullish reversal pattern for an ongoing trend. They are opposites of the rounded tops- except that prices break down above the neckline to complete the formation.
Trading rounded bottoms require setting stops at the lowest low points below the neckline and taking profits at reasonable risk to reward ratios. However, with a favorable entry, you can ride into profits to the extreme exhaustion of the bullish trend.
#9. Ascending Triangles Chart Patterns
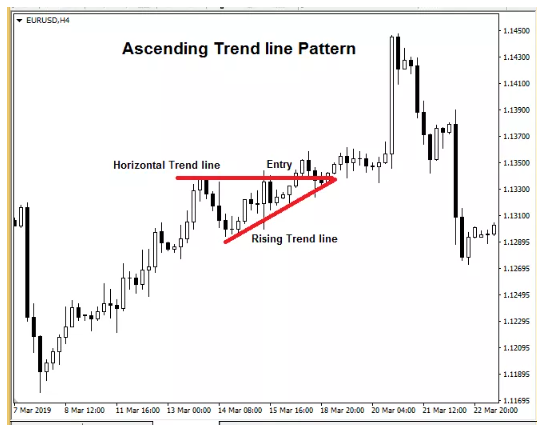
Ascending triangles signal a bullish continuation pattern – price breaks may sustain within a bullish trend. First, notice the horizontal line where prices face resistance on the ascending triangle within a rising ongoing trend.
The rising trend line is where higher-highs mount pressure on the horizontal resistance line-o an ascending triangle. Eventually, prices break the resistance and shoot higher, sustaining the bullish narrative. It's best to approach trades by firming your positions with technical analysis.
#10. Descending Triangles Chart Patterns
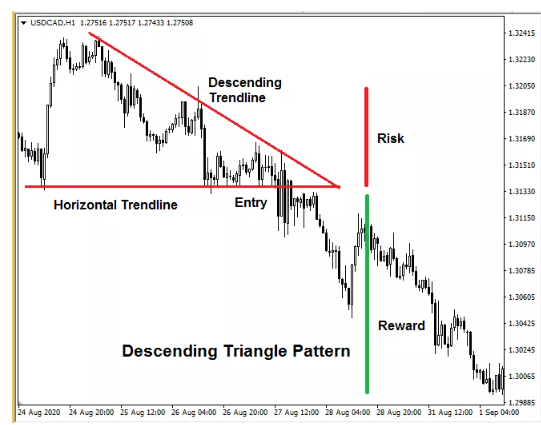
As the name suggests, the descending triangle pattern piles pressure on support lines, and eventually, sellers break past the support. As time elapses, the triangular trendline forms lower lows inching towards the point of breaking past support.
Trading the descending triangle presents two opportunities: One is to continue selling or going short. The second is to add more entries and exit at lower points after prices get past the support lines. Take more caution via technical analysis and trade carefully by taking profits at reasonable risk to reward ratios.
#11. Falling Wedges Chart Patterns
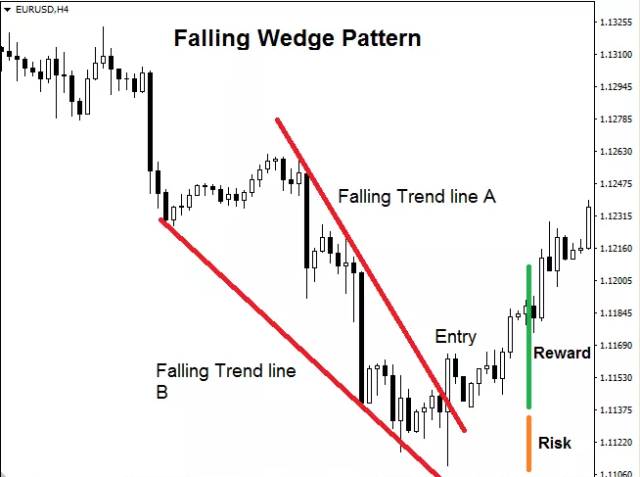
The falling wedge pattern is an indication of bulls in control of the markets. And it appears within the continuation of a falling trend in form of a bearish rectangle. Prices oscillate within two falling trendlines but primarily fall towards the lower limits where trend reversal gathers momentum.
At the point of reversal, the prices must break away from within the confines of the rising wedge. Trading the falling wedge, work with a risk to reward ratio of 1:2 where potential take profits are within or beyond the range of the previous symmetrical triangle on a forex chart.
#12. Rising Wedges Chart Patterns
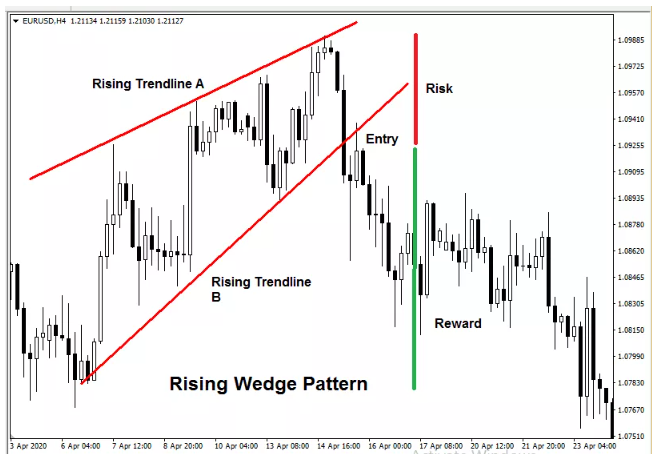
A rising wedge pattern in FX trading is as the name suggests. Prices keep rising but oscillating within the confines of the two extremes of the wedge formation. However, note that the wedge trendlines keep rising but never actually converge at the highest point.
Traders confirm entry positions when prices make a break past the lower trendlines. While trading the rising wedge pattern, place stops within the confines of the trendlines, and the book takes profit positions with reasonable risk to reward ratios with subsequent price falls. Also, if a bearish trend favors your entry, it's an opportunity to trade profitably as long as the bearish trend sustains.
#13. Rising Pennant Forex Chart Patterns
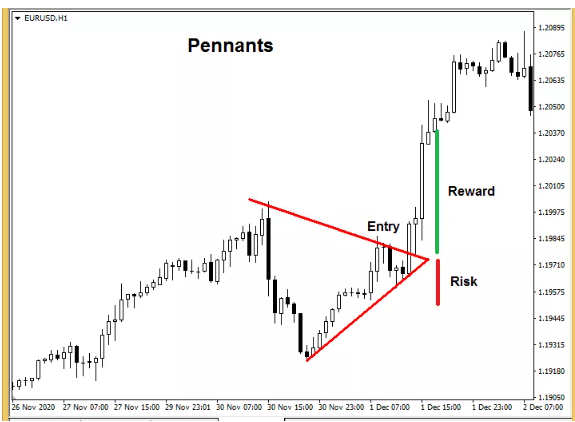
Generally, pennants a trend continuation patterns, and the longer-term trends sustain after the pennant completes formation. The pennants appear: traders closing out trades while prices hit target take profit positions. Prices stray briefly from the main trend only to gather momentum and resume along with the trend. Also, the pennant formation takes a form of a triangular form within the main trend on the forex chart.
To confirm a bullish pennant pattern, the prices must break above the trendline formation, attempting to resume the ultimate trend.
#14. Falling Pennant Forex Chart Patterns
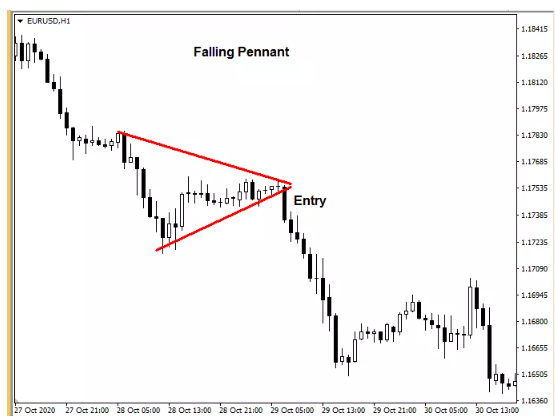
Falling pennants are signals for bearish continuation where downside breakout(s) persist on longer timeframes. Therefore, price movement within the falling pennant attempts to resume the downward trend after a brief pause.
Both new and expert traders can easily trade the falling pennant formations. If conditions allow, traders add more positions to take profit by targeting lower levels of the downtrend – but of course, with good risk for reward in mind plus coverage with technical analysis on your forex chart.


Most Profitable Forex Chart Patterns
The most profitable forex pattern is the Head and Shoulders pattern. But that does not confine a trader to limiting their trades to the pattern alone. However, it's a great formation that one should pay attention to.
Other factors may swindle a trade the opportunity to reap maximum profits from the head & shoulders shape/pattern in FX. As guided in other posts, always work with caution: confirm entry points with other indicators. Of course, after taking time to analyze the markets adequately.
Overall, it’s best to work with an open mind in FX trading. It means that your target is not to remain searching for the Head & shoulders shape/pattern. There are many more chart formations you can explore as a trader and ride on the opportunities they present to upscale your profitability potential and avoid losing money rapidly.
It goes without shouting -shapes and formations on a forex chart are not a guarantee to profits. Therefore, the key is trading after analysis and caution to protect capital first and take maximum profits when favorable.
Forex Chart Pattern Cheat Sheet

The best cheat sheet for trading patterns in forex for any particular market is:
- First, grasp the formation concept with each pattern.
- Next is to trade, following the rules for each.
Patterns do not form as fast as traders would wish – it's the patience to wait and confirm things and the confidence to trade when conditions are optimal.
Forex Candlesticks Patterns

While patterns have definite entry points, the mastery of reading candlestick patterns also counts to a greater extent. It's great if a trader is not carried away with the excitement of a clear pattern forming. And greater if an entry point is confirmed with candlesticks formations plus other technical indicators over the timeframes.
Overall, it's to accept that patterns are a great way to enrich your trading. However, mastery of reading candlesticks on a forex chart and trend line is the precursor to profitable trading by building on correct and timely entry after identifying any forex pattern.
Limitations of Chart Patterns

Forex patterns are not your sure bridge to profitable trading. Much more input is required to help you make correct confirmations. At best, open a trade with two plans – exit with a small loss when things go wrong or reap huge profits when things go right.
Always trade any continuation patterns depending on the overall trend formation on longer time frames. It's essential to hold patiently and confirm directions first. One mistake traders fall into is trading technical patterns impatiently. It's the psychological battle to steer away from the fear of missing out.
Pattern formations are not guarantees of future price predictions for currency traders on complex instruments. However, the most beautiful thing is that amazingly profitable traders take time to plan out – and enter trades confidently and away from the vices of fear and greed.
Best Forex Trading Course

Are you looking for the best Forex trading course? Join the world's best trainer/mentor – Ezekiel Chew.
Ezekiel is the mastermind trainer behind Asia Forex Mentor and the One Core program, which trains beginners and expert traders in making 6 figure trades – even for retail investor accounts. The course is a life-changer that is backed by theoretical practice and numbers from a trainer who's trained institutional traders and banks. One Core Program covers all concepts applicable to currencies or complex instruments
One core program is a rare course that features live trading and mentorships by the lead trainer. One other hidden characteristic of Ezekiel Chew is his way of giving to the community – by training others willing to invest in knowledge that he shares as a living example and earns from FX trading. You can subscribe today for a free eBook on the masterly of successful trading. Or chat with the team. Lastly, the Asia Forex Mentor website has tons of helpful material you can explore, all for free to help you make up your mind and prepare to join the One Core program.
Best Forex Brokers
Conclusion: Forex Patterns

Forex pattern formations offer excellent opportunities to enter the markets at the right moments. Since markets do not talk, forex (FX)patterns are one way to help traders figure out what prices are saying on any timeframe.
Patient traders have one thing, they wait for the formations to form and use other tools to confirm the right moments to enter a market(including fundamental analysis).
Identifying a pattern is not the end; it's the start of things – where other factors pile in to help you trade the right ways into profits. The key component is to refit a pattern formation into a tried and tested strategy. For instance, check with two or three indicators concurrently and make a decision with a chart formation. Also, traders should not entirely forget the many things to do with fundamental analysis and forecasts.
Forex Trading Chart Pattern(s) FAQs
Do Patterns work in Forex?
The most common chart patterns work in forex. And the beauty is, they form in limitless fashion into future time frames- and with that also unfolds the fantastic opportunities to trade confidently. There's no doubt. Taking time to spot one takes patience and long timeframes observing and analyzing.
The best way to approach forex (FX) patterns and trading is to view them as an icon to a cake- they only make the cake sweeter. So patterns are one of the stepping stones towards the greater heights of analyzing price formations.
Confidence helps you trade excellently by grasping the facts and reconfirming price behaviors. The last point to note is that patterns should not be an excuse to trade with greed and fear!
What is the best forex chart pattern?
The head and shoulders pattern is the best trading pattern. And it appears as a reversal pattern that gives traders adequate time to plan – reconfirm price directions, other factors, including correct leverage and lot-size estimates. Notably, prices following this pattern have only one course of direction. It's not among the complex or bilateral chart patterns – where prices may move either way.
The other beauty of prices is that they must come down in the future whenever they go up. Trend reversals happen both ways – breaking support and resistance levels over time. While the head and shoulders favor traders and the hoped-for downtrend, bulls wait for the reverse to form- the inverted head & shoulders shape/pattern.
Good traders must not remain fixated on the head & shoulders shape/ pattern only. Many profitable patterns show up in many currency pairs limitlessly. So looking and targeting correctly, you have very many chances to profit- of course, doing everything a great trader does – trading without high risk.
Last point here – pay attention to bilateral chart patterns. For them, prices either follow a continuation chart or reverse entirely.
What are the chart pattern(s) in forex?
In forex, the patterns are distinct formations that traders can identify with typical shapes. It makes it easier to read the prices.
Patterns in forex give trading a universal approach to help traders make decisions to trade profitably into future time frames.
Agreeably, forex (FX) patterns are not an excuse to trade without caution of high risk. The best way is to refit in the pattern formation, starting by identifying one and taking adequate time to see if your pre-plans work out. The key thing is that trading smartly with a good strategy only gets better with patterns in forex.


