

Want to jump straight to the answer? The best forex broker for traders is Avatrade
The #1 Forex Trading Course is Asia Forex Mentor
One of the most significant challenges confronted by wall street traders and analysts is when to either buy or sell a financial asset. All financial market traders learn various analytical methods and strategies, all in a bid to predict the price moves of an asset of interest. Technical analysis is one of the popular methods used to analyze and predict future price movements by studying previous price actions of the markets.
Technical analysis also entails the use of various technical indicators and other trading tools to analyze the price charts of trading instruments on various timeframes. Donchian channels are one of the numerous indicators deployed in technical analysis. In this article, we will describe the indicator, how it works, its strategies, pros, and cons as well as its differences from a similar indicator; Bollinger bands.
Also, we’ve got Ezekiel Chew; the successful trader and training expert, to share his take on Donchian Channels. Finally, we will round off with the best trading course also created by Ezekiel Chew.
What is Donchian Channels?
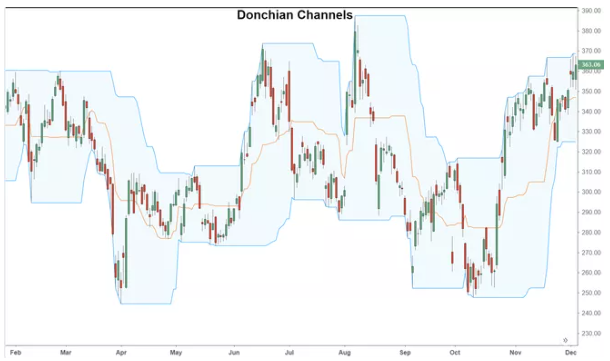
Donchian Channels is a technical indicator used to measure the volatility of a financial instrument. It comprises three lines formed from calculating the highest highs and the lowest lows of the last defined number of periods. It is available on many trading platforms used to trade the financial markets.
Donchian channels were developed by the American veteran futures trader; Richard Donchian in 1936. He wrote several articles which have become classics that have formed the basis for the development of other tools and indicators. He was later known as “the father of trend following”.
The Donchian channel has the following lines on the chart:
- The upper band
- Middle band
- Lower band
To calculate Donchian channels, we use the following formula:
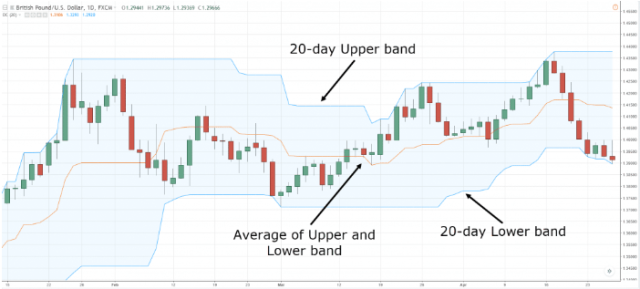
- Upper band = Highest high in the last n periods
- Lower band = Lowest low in the last n periods
- Middle line = average of the upper and lower bands
Follow the steps below the plot the Donchian channel on the candlestick charts:
- Choose a period; the default setting is usually 20 periods
- Compare the high prices for the period selected and choose the highest price
- Plot the values for the moving high prices. This gives the upper channel or upper band
- Also, compare the low prices for the same 20 periods and choose the lowest price
- Plot the values for the moving low prices. This line is the lower band or lower channel
- Find the moving average calculations for the upper and lower bands
- Use the values to plot the middle line
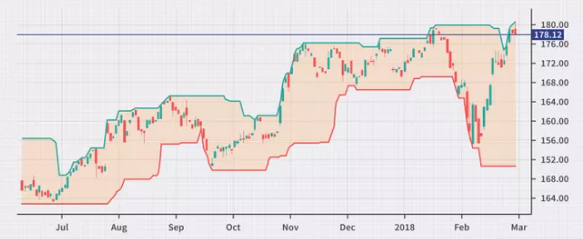
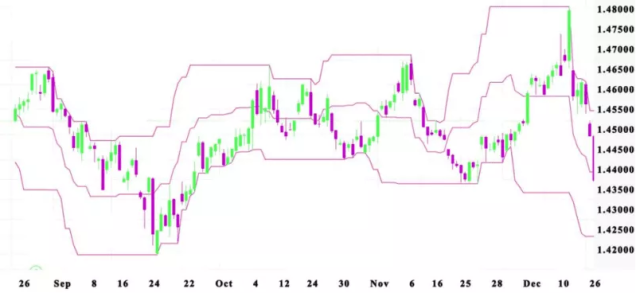
The area between the high and the low is the channel for the 20 periods chosen. Each line is colored differently and can be customized by the trader or analyst.
What do the Donchian Channels Indicate?
The Donchian channels compare the current price and the price ranges within a defined period. A quick glance at the channel or enclosed area gives the trader an idea of the market condition as well as the bullish or bearish strength. The position and size of the lower and upper bands may be enough to generate trading signals for a trader.
The upper band indicates the bullish energy as it is plotted with the highest price within the period. Similarly, the lower band is plotted from the lowest price in the period, so it depicts the bearish energy. The middle line acts as the median band obtained through the struggle between the buyers and sellers of the traded asset within the period of study.
The size of the channel may be used to measure volatility as follows:
- In times of high volatility, the area of the channel is wide
- When the channel area is small or tight, it means that liquidity is high and prices are stable
When the price reaches the upper band, it may be perceived as an overbought market but when it touches the lower land, it is an oversold signal. Most times, this needs confirmation as a long-term trend may hug the lower or upper channel for a long time. A sustainable bullish trend may be confirmed if the price breaks the upper band. Similarly, in a bearish trend, if the price breaks the lower band; it indicates a strong downtrend.
Donchian Channels Trading Strategies
Just like all indicators, the Donchian channels can be used by traders to generate trading ideas or trade signals. Traders also use the Donchian channels to identify potential breakouts, pullbacks, and reversals. Here are some of the trading strategies derived from Donchian channels:
Breakout Trading Strategy
This trading strategy sees the upper and lower band as resistance and support lines while the trader monitors the price action within the bounded area. The trader's aim is to predict when the price will break through the upper or lower band so that he can open a long or short position in order to profit from the breakout.
In a bearish trend, the trader ensures that the prices are below the middle line and so, he opens a short position and maintains it until the price hits the lower channel and possibly breaks through it. In the same vein, a long position is opened in a bullish trend when the price rises above the middle line. Some traders wait for the previous high to touch the upper line before opening the position. This is done to minimize the occurrence of false signals.
The major challenge here is to predict if the breakout will happen or not. Most traders use other indicators like the Average Directional Index (ADX) to help with determining the strength of the trend and predict if it is strong enough to break through the channels.
Reversal Trading Strategy
This trading strategy requires patience from the trader until he identifies a potential price reversal. He will keenly monitor the middle line of the Donchian channels and observe when the price crosses it. The aim is to identify a potential price reversal and trade it.
When the price reaches the middle line from below forming a bullish trend, the upper band serves as the resistance. Once the price hits the upper band, the trader may open a short position in anticipation of a reversal. He first determines the strength of the trend and should be convinced that it is not potent enough to break through the resistance or upper band.
Most reversal traders combine the Donchian channels with the RSI indicator for clearer and better signals.
Difference between Donchian Channels and Bollinger Bands
Bollinger bands (BB) is a technical indicator that can be used to identify a trend and determine overbought and oversold levels. BB comprises 3 lines obtained as follows:
- The middle line is a simple moving average of the closing price of 20 daily values. The assumption is that we are using daily timeframes and a period of 20
- To obtain the upper band, calculate the standard deviation (SD) of the same 20 periods. Add 2SD to each of the simple moving averages (SMA) obtained above and plot the values on the chart
- For the lower band, subtract 2SD from each of the SMD values and plot it on the chart
The Donchian channel indicator is very similar to the Bollinger bands in several aspects. They both have 3 bands that tighten in times of liquidity and widen in times of volatility. A bearish trend is characterized by the price hugging the lower band and vice versa; that is, the price also hugs the upper band in a strong bullish trend.
The major differences between Donchian channels and Bollinger bands are as follows:
- BB was invented by John Bollinger in the 1970s while Donchian channels were from Richard Donchian
- Difference formulas are used to plot the points on the indicators. Donchian channels use the highest price and the lowest price in a given period to calculate its points while BB uses moving averages and Standard Deviations
Donchian Channels Indicator Pros and Cons
Pros
- It is easy to read without much analysis; this makes it beginner friendly
- It can generate signals for both trending and ranging markets
- It works on a wide variety of assets in the financial markets including stocks, forex, etc
- Traders can visualize volatility from the indicator
Cons
- It gives inaccurate signals on low timeframes; this makes it unsuitable for scalping and other short-term strategies
- It works best with other indicators implying that should not be trusted as a standalone indicator
Best Forex Trading Course

Ezekiel Chew is a renowned forex trader, trainer, and industry expert. He has trained professional and retail forex traders as well as corporate finance players like bank traders, money managers, and asset investors. From his trading experience drawn from over 20 years of trading the forex markets, he has created a comprehensive forex trading course known as “the one core program”.
Ezekiel asserts that the one core program is designed for the ‘committed learner', so previous trading knowledge or experience is not required before you can enroll in the program. The program comprises over 60 video lessons that teach proprietary trading strategies that are backed by mathematical probability and technical analysis principles.
The one core program has been proved to be highly efficient as it has generated millions of US dollars for Ezekiel Chew and his students. There are numerous testimonials from students that have graduated from the program and are now making six-digit figures per trade just by applying the techniques learned from the program. The one core program is available on the Asia Forex Mentor website; which is a forex trading blog that has been existing for over a decade.


Best Forex Brokers
Conclusion: Donchian Channels

The Donchian channel is a trend-following indicator developed by Richard Donchian. It consists of an enclosed channel plotted with 3 lines representing the upper, lower and middle bands. The upper band is plotted from the highest price within a period while the lower band is plotted from the lowest n periods. The middle line is the average of the two lines.
Donchian channels show the bullish strength from the upper band and the bearish strength from the lower band. A wider channel means high volatility while a narrow channel means high liquidity. When the asset's prices stick to the higher or lower band, it can be interpreted as a strong trend.
Breakout trading is a popular trading strategy supported by the Donchian channels indicator. Traders use the higher and lower channels as resistance and support lines and seek to trade the breakout as the prices break through any of the channel areas. Reversal traders and trend followers also use the Donchian Channels indicator.
Bollinger bands is a popular indicator that looks similar to the Donchian channels but is a completely different indicator. Their developers are different and their formulas are different. BB uses simple moving average and standard deviations while the Donchian channel uses highest and lowest prices for its computations.
Donchian Channels FAQs
Is Donchian Channel Reliable?
The Donchian channels is very helpful, easy to learn, and generally a good starting point for new traders. But, it may not be a complete trading tool for expert traders who need a complex trading style or system. The indicator is often used in conjunction with other indicators.
Additionally, traders who like trading short timeframes will not find the Donchian channels reliable.
Is Donchian Channel the same as Price Channel?
Yes. The price channel indicator which appears on some platforms has the same description as the Donchian channels. The same formula used in calculating each of the 3 bands that make up the Donchian channels is exactly the formula used to calculate the Price channel indicator bands.

