
Want to jump straight to the answer? The best forex broker for traders is Avatrade
The #1 Forex Trading Course is Asia Forex Mentor
Indicators are important tools used in the technical analysis of financial markets' assets. They are used to generate and also confirm trading signals. Many professionals who trade forex and stocks deploy technical analysis principles which rely on historical prices to predict future price movements.
They also develop various strategies by combining various indicators and analytical theories. Many indicators are available on the various trading platforms across the financial markets. The directional movement index (DMI) is a popular indicator and has become part of many software platforms.
In this review, are going to explore the DMI indicator, its components, how it is used, and its disadvantages. We will also check out its market predictions as indicated by crosses and differentiate it from another similar indicator. Also, we've got ‘Ezekiel Chew‘ who is a renowned financial markets expert trader and trainer to share his take on the DMI indicator. Finally, we will end with the best forex trading course.
What is DMI Indicator?
The Directional movement index (DMI) is a technical indicator developed by J. Welles Wilder Jr in 1978. It is one of the indicators that was included in his book titled “New concepts in Technical trading systems”. DMI is used to measure the trend strength and also the trend direction by comparing the previous high and previous low prices of a financial instrument.
Basically, DMI is a combination of 3 indicators namely:
- Plus Directional Indicator (+DI)
- Minus Directional Indicator (-DI)
- Average Directional Index (ADX)
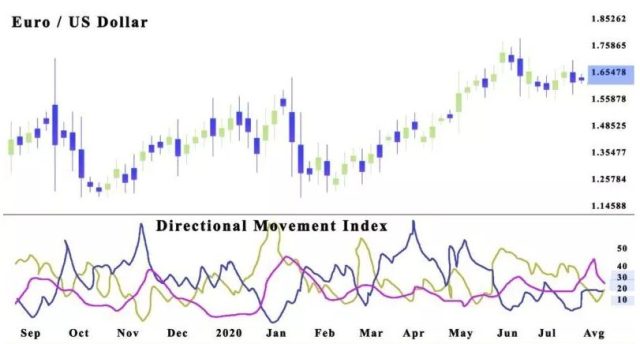
Some trading platforms separate the indicators; making the ADX available separately, but the DMI groups them together. The indicator is displayed below the price chart and comprises 3 lines representing the +D1, -D1, and ADX indicators. The lines are colored differently; by default the +D1 is green, -D1 is red while ADX is black.
But, the trader can customize any or all of them to suit his preferences. A combination of all three indicators makes DMI a powerful indicator used by many technical analysts to identify a weak or strong trend as well as its direction movement.
The formula for DMI is as follows:
+DI = ((ATR Smoothed +DM) / ATR) ×100
-DI = ((ATR Smoothed -DM) / ATR) × 100
DX = (∣+DI–DI∣ )/( ∣+DI+-DI∣) X 100
ADX = (Previous ADX x 13) + (current ADX readings)/14
where +DM (Directional Movement) = Current High price − Previous high
-DM = Previous low – current low and ATR = Average true range.
This formula is based on the default indicator settings with 14 as the period. But, the trader can change all the parameters in the indicator settings; he can also choose to use other prices such as opening prices instead.
How to Read Directional Moving Average
Willes Wilder used 7 periods on the daily charts to explain this volatility indicator using the previous day's lows and high price ranges. Today, periods 14 and 20 are commonly used. The average directional index (ADX) line does not show the trend direction but only indicates the trend's strength.
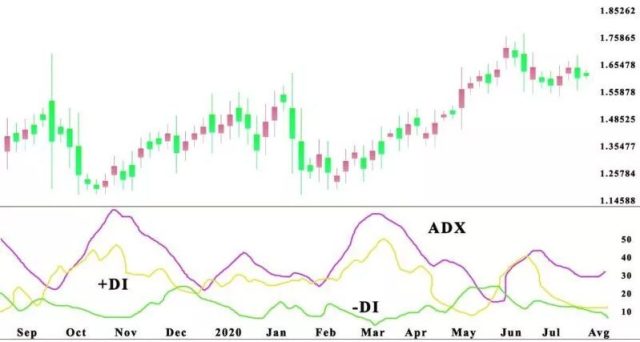
The +D1 and -D1 are direction movement lines that shows an uptrend or downtrend. If the ADX is above 25, it indicates the presence of a trend. Lower values mean that there is no major trend or the current price is moving sideways.
To determine the direction of the price, check the levels of the other indicators.
- When the +D1 is above -D1 and the ADX reading is above 25; then it is an uptrend
- If -D1 is above +D1 and the ADX reads 25 or higher; then, a strong downtrend is indicated
The Disadvantage of the Directional Movement Index
A major drawback of the Directional movement index (DMI) indicator is that it frequently gives false signals. Perhaps, because it is a lagging indicator that makes use of the previous price range of the traded financial instrument. So, it does not really show what may happen in the future.
When used on smaller timeframes, such as M1, and M5; the lines often criss-cross; thereby generating multiple signals even without a definite price trend. As a result, the DMI becomes inaccurate as it gives the wrong signals. This means that the technical indicator is not suitable for trading strategies like scalping but can be useful in swing trading and day trading. To avoid a losing trade, it is better to use it on higher timeframes and be wary of false trading signals.
Many traders who use this momentum indicator often combine it with other indicators such as the Relative Strenght Index (RSI); which also comes from Welles Wilder. RSI is used to check if the market condition is overbought or oversold.
For example, some strategies advise the trader to go long when the ADX is above 35, +D1 is less than -D1 and RSI is below 50. Similarly, you can open a sell position if the ADX is above 35, +D1 is greater than -D1 and RSI is above 50.
Bearish and Bullish Crosses
Just like other indicators, the DMI can be used to generate trade signals once certain conditions are met. Directional Movement Index (DMI) crossovers are often used by traders to indicate trading opportunities.
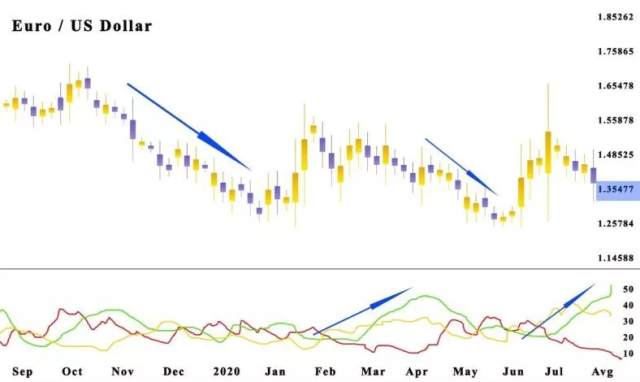
Generally, when the +D1 crosses above the -D1, an uptrend is forming. The trader can open a long position if the +D1 crosses the ADX line above 25; the stop loss can be placed at the current low.
A selling signal is indicated when the ADX is above 25 and the -D1 crosses the +D1 line. The trader can open a sell position with a stop loss at the current high. The sell signal can be confirmed using other indicators. The Directional movement index can also be used as a confirmation tool to affirm or invalidate the larger trend direction.
Difference between DMI from Aroon Indicator
Aroon is a technical indicator that is not as popular as the Directional movement index but they are somewhat similar. Aroon identifies the changes in the price direction of an asset and also measures the trend strength. It was first calculated in 1995 by Tushar S. Chande; a financial analyst and author who holds up to 9 patents in the United States.
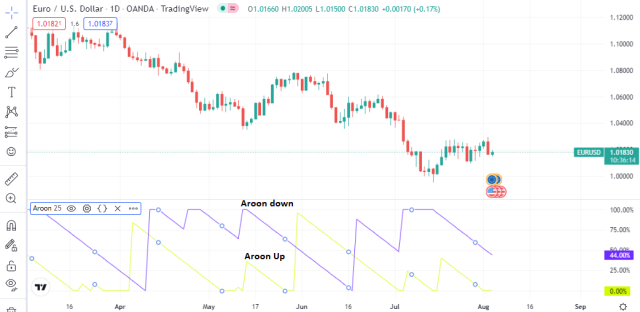
Aroon has two lines as follows:
- Aroon up: it measures the uptrend's strength
- Aroon down: this measures the strength of the downtrend
Just like the DMI, a bullish price movement is envisaged when the Aroon up is above, and a bearish movement is expected when the Aroon down is above the Aroon up line. Crossovers are similar to that of DMI and also indicate a price directional change. When the Aroon down line crosses the Aroon up line, it indicates the starting of a new downtrend and vice versa.
The major difference is that DMI has the ADX line making it 3 lines. Also, the same calculation is not used as the calculations for the Aroon up and down are completely different from that of DMI's +D1 and -D1. It is as follows:
- Aroon Up = ((25 – Periods since 25 period high)/25) X 100
- Aroon Down = ((25 – Periods since 25 period low)/25) X 100
This is for Aroon with a period of 25. The indicator range is between zero and 100. A reading above 50 indicates that the Aroon high or low appeared within the last 12 periods and below 50 means that it appeared within the last 13 periods.
Some platforms come with a default period of 14 but the trader can always change the period for any number of periods he wishes.
Best Forex Trading Course

Ezekiel Chew is a successful forex trader who understands technical analysis and its underlying principles. For several years, he has been an industry expert, speaker at important industry events, and a sought-after trainer. He has trained bank traders, professional traders, corporate finance players, and retail traders as well.
From his 20 years of experience in trading the financial markets, he created the ‘one core program' which can be obtained from the Asia Forex Mentor website. The trading course teaches some proprietary trading strategies which he developed based on statistical and mathematical probability principles. You do not need any prior knowledge of trading or experience as the course teaches from the scratch, so it is suitable for beginners.
Already, Ezekiel Chew and his students make 6-digits per trade, courtesy of the proprietary strategies taught in the one core program. There are several testimonials from his students that have gone from zero to millions of dollars in profits. So far, the one core program is the best forex trading course on the internet because it is comprehensive, affordable, and highly effective.


Best Forex Brokers
Conclusion: DMI Indicator

The directional movement index (DMI) indicator comprises two separate lines representing the positive and negative movement in the price direction and an optional third line which is the trend strength line known as the average directional index (ADX). DMI is an indicator developed by J. Welles Wilder which he described in his books along with other indicators like Parabolic SAR, Relative Strength Index, Average True range, etc.
The indicator +D1 is obtained by comparing prior highs of the traded asset while -D2 compares the current low and the previous low prices. Then, the overall average directional movement index (ADX) is obtained as the smoothed average of the last 14 periods of the trend indicators.
Trading with the Directional movement indicator is relatively straightforward: the key takeaways are: when +D1 crosses -D1, expect an uptrend and a downtrend when -D1 crosses the +D1 line. Trade signals can be generated when the ADX is above 25 as it means a strong upward or downward price trend. You need to confirm with a trend following indicator or other indicators because sometimes DMI gives incorrect signals, especially on lower timeframes.
DMI Indicator FAQs
How do you read a DMI Indicator?
The directional movement index (DMI) is made up of a positive directional indicator +D1 and a negative directional indicator -D1 and a third line known as the average directional index (ADX). The directional movement shows the price movements; which may be upwards or downwards while the ADX shows the strength of the trend. A strong trend is usually indicated by an ADX value is 25 and above.
How do you use ADX DMI Indicator?
The Average direction index is a stand-alone indicator on some platforms. The indicator range is from zero to 100. In some platforms, the DMI consists of 2 lines; the +D1 and -D1 which shows the price direction of the traded asset.
But the ADX DMI indicator combines all the indicators by displaying the +D1, -D1, and ADX lines below the price charts of the asset. So, a trending market is identified when the ADX is above 25 while its direction is determined by the position of the other indicators. When the +D1 is above the -D1, then the price is moving upwards but when the +D1 is below, then it is trending downwards.


