
Want to jump straight to the answer? The best forex broker for traders is Avatrade
The #1 Forex Trading Course is Asia Forex Mentor
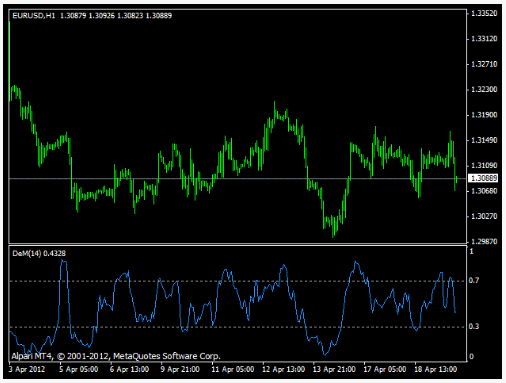
The DeM indicator is a technical indicator that falls under the momentum indicators used to assess risk levels. It generates value by contrasting the lowest and highest prices attained in the current period. To understand the DeMarker indicator, we must first understand what it is used for and how it works. And for that, we have got Ezekiel Chew to understand better and explain the DeMarker indicator.
Ezekiel Chew is the co-founder and CEO of Asia Forex Mentor, one of the world's largest and most successful forex education companies. He is a highly sought-after speaker and trainer, having been featured on some of the biggest platforms in the forex industry. In this guide, we will discuss everything you need to know about the DeMarker indicator, how to use it, indicator trade signals, and more. So, without further ado, let's get started.
What is DeMarker Indicator
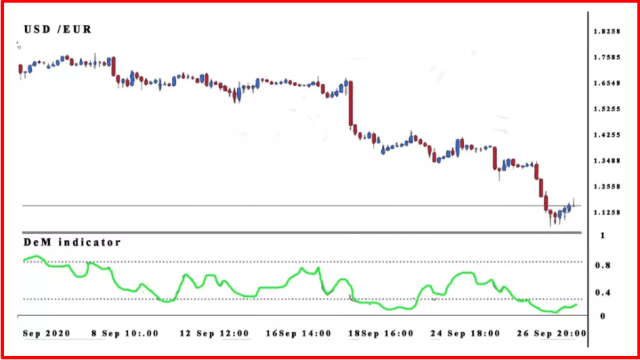
The DeMarket indicator, also known as DeM, is a technical analysis tool that measures an asset price's relatively high and low demand for an underlying asset. DeM can be used in all time frames and by traders of all experience levels. However, this technical indicator primarily identifies possible market tops, bottoms, and reversals in a given asset’s price.
The DeMarker Indicator is a member of the oscillator family of technical indicators. Oscillators are indicators that identify possible reversals in an asset’s price. The DeMarker indicator is unique among social media stocks such as Facebook, Twitter, and LinkedIn in that it measures the demand for an asset rather than the supply.
This technical indicator also attempts to estimate the market's directional trend. It can show you when an asset is overbought or oversold and may utilize the information to find significance levels. The indicator is based on the principles followed by technical analyst Tom DeMark. It's available on most trading platforms and was originally designed with daily price bars. However, it may be utilized at any time based on relative price data.
DeMarker Indicator Trading Strategy Explained
The DeMarker indicator is primarily used as a momentum oscillator. Traders use the DeM indicator to determine the appropriate time to gain maximum profits from probable imminent price trends. In addition, it is also perceived as a leading indicator as it can indicate the change in price trends.
Like other indicators, DeM is most often used in tandem with other trading strategies. The data it generates is utilized to measure price exhaustion, assess risk, and identify market tops and bottoms. The main difference between the DeM and the Relative Strength Index (RSI), a more popular oscillator, is that the DeMarker indicator focuses on intra-period highs and lows rather than closing levels.
However, the DeM indicator can easily resist the distortions in the case of unpredictable price movements, which generally occur at the market tops and bottoms. Therefore, this makes it a more reliable tool for measuring price momentum than other oscillators.
How to use the DeMarker Indicator
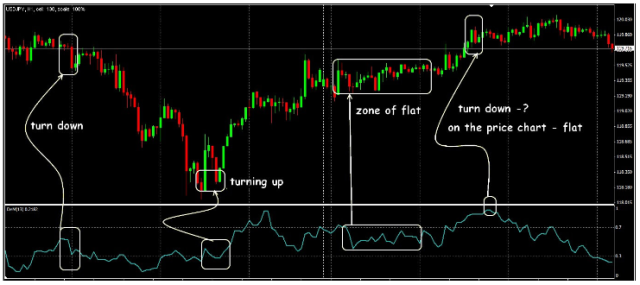
The DeMarker trading technique is hostile and looks for a price reversal inside a verified market trend indicator. By themselves, the indicator's overbought and oversold regions are enough to indicate a reversal.
Most of the time, overbought and oversold conditions are unusual, and the representative data generally produce estimated low and high prices. So instead of signaling a reversal, going into these areas might indicate a broader trend.
When a stock is overbought or oversold, the price may rise or fall considerably in one day. Buying pressure is shown by overbought stocks strongly, and strongly oversold stocks reveal selling pressure.
Now the question is how to take advantage of the overbought and sold indications to understand the market situation better. You must determine how long the market was in overbought or oversold territory. You may then decide whether the market is simply ranging if it's in a modest or strong trend.
These parameters show whether the market is trending or not. For example, when the market remains in extremely overbought conditions for a long time, it indicates that the market is rising.
Buying is the most practical choice when the price drops temporarily in an overall trend or spikes during a downturn. The best way to discover these possibilities is to look for indicators that have moved out of overbought or oversold ranges.
As an investor, you need to realize that the recommended values are just suggestions for a starting point. Investors that are hesitant to trust the accuracy of the values are naive and risk losing money rapidly. However, the best way to use this indicator is to test and then locate the optimal values for the security you are trading. It is possible in demo versions available in the trading software.
Mostly, the longer the period, the smoother the curve is. A larger boundary helps you create precise oscillations by varying it for overbought and oversold conditions.
Although the DeMarker trading strategy is useful in indicating a market, using additional data from different indicators to validate the initial findings is encouraged. Indicators don't analyze identical information, and various indicators can yield varying interpretations of market data.
The asset's price acts differently than the oscillator in a divergence. These are one-of-a-kind circumstances, and it's better to use additional oscillators to ensure they don't continue.
Indicator Trade Signals
Most traders classify the DeM indicator signals into four groups that are as follows:
#1. Attitude is Overbought or Oversold Areas
The typical explanation is that if the signal strength in an area is over 0.7, it implies patience and expecting a maximum. At the same time, under 0.3 recommends that patients come down to a minimum and advance up. Trades begin in the direction of the indicator's reversal, with a sell signal at the breakdown at level 70 down and a buy open for level 30 up. This DeMarker signal is perceived as a continuation of the pattern.
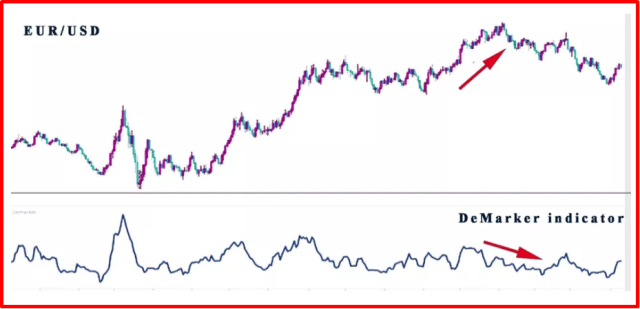
#2. Divergence of the Indicator Line and Price
When the indicator value diverges from the price, it strongly indicates an impending change in trend direction. The bullish and bearish divergences can be utilized to recognize the suitable moments for a reversal. Bullish divergence happens when the price creates lower lows, and at the same time, the DeMarker indicator creates higher lows. A bearish divergence is when a downward trend shows signs of ending, whereas a bullish divergence occurs when there is evidence of growth. Triple divergence is the most reliable indicator.
#3. The appearance of the Graphic Patterns on the Oscillator Line
When particular patterns emerge on the DeMarker line, it can signal a potential trend reversal. For example, the formation of a head and shoulders pattern on the DeMarker line is a bearish signal. The pattern is created when the DeMarker line forms three peaks, with the middle peak being the highest and the two side peaks being lower. The DeMarker indicator's weakest signal is the Pink Line. However, in most cases, it predicts a price chart breakthrough.
#4. Breakdown of the Resistance and Support Line
The trend line, drawn by the minimum and maximum lines, signals to buy or sell during the breakdown. When the DeMarker indicator line breaks below the support line, it signals to sell. On the contrary, if the DeMarker line breaks above the resistance line, it is a signal to buy.
DeMarker Indicators Effectiveness

The DeMarker indicator strategy is implemented by technical traders to time the market, yet some people are critical of the logic behind these indicators, and the standards used lack evidence.
Studies have shown that signals are rarely generated, making it a difficult tool for timing the market. In addition, indicators are insufficiently developed to show that the indicator's forecasting capability is limited.
The DeMarker indicator is presented as a tool to track time reversals in a trend and significant price changes that occur along with a signal. However, this isn't just the case with this indicator; we all know that false signals are quite common, which is why it's generally advised to use additional technical indicators to confirm questionable signals.
Best Forex Trading Course

Asia Forex Mentor offers the best forex trading education in Asia. The course is set up so that you can earn money while learning. You'll be able to trade forex profitably with a skilled trader's help. In Singapore and other sites worldwide, tens of thousands of people from the United States, the United Kingdom, and other Asian countries have been taught.
Ezekiel Chew's teaching method is founded on the principle of return on investment, which states that if you invest $1, you will gain $3. It's not about zany strategies or elaborate procedures. Professional traders and financial organizations use his authorized system. He is the driving force behind the growth of various companies, including DBP, the Philippines' second-largest state-owned corporation.
Due to his strategy's effectiveness, many full-time traders have joined the program with little to no prior trading experience and emerged successful.


Best Forex Broker
Conclusion: DeMarker Indicator
Traders use the DeMarker indicator with a risk appetite to estimate the market's interest in the underlying asset. It is intended to compare the most recent maximum and minimum prices to the previous period's equivalent price as an oscillator. The DeMarker determines the market's direction and changes in trend direction according to these factors.
However, as it is a momentum oscillator, it is lagging and, as such, is not the ideal indicator. The DeMarker indicator should be combined with other technical indicators to generate more reliable signals. The most significant advantage is that the indicator shows supply and demand pressure. Within a price trend, the DeMarker indicator can indicate possible interim reversals.
The day traders do not use the DeM indicator. However, professional traders like to use it for its easy use for different markets and assets. Moreover, it has found a place in charts that examine cryptocurrencies.
While the DeMarker indicator is a great tool, it should not be used as the only indicator for trading decisions. Keep an eye on the warning signals and divergences, as they can help confirm potential market reversals. While past outcomes are not a guarantee of future success, you should take advantage of the tool's strengths and never accept data from another source; this way, gains will be substantial while losses will be minimal.
DeMarker Indicator FAQs
How accurate is Tom DeMark?
Tom DeMark is a well-reputed indicator but is not 100% accurate like any other technical indicator. On the other hand, the Oscillator has a track record for outperforming other indicators. According to anecdotal evidence, it has a better than average success rate than other technical indicators. To stay in the profitable zone, combine it with another instrument to validate the signals it offers.
How do you calculate the DeMark Indicator?
The DeMarker indicator's formula is pretty simple, determined by looking for the highest values in a given period. It is recorded as zero if the current high value is lower than the previous high.

