
Traders like gold because it has been strong and stable in the financial markets. At first, 2024 was seen as a good year for gold because the Federal Reserve was expected to cut interest rates by a large amount. With six 25-basis-point cuts planned for the beginning of the year, gold was expected to become a more appealing non-interest-bearing asset, especially as global tensions rose. Nevertheless, the market's view has changed, now matching the Fed's prediction of only three rate cuts, which caused yields to rise. Even so, gold's value has held up well thanks to strong demand, as shown by China's record gold imports since the middle of 2018 and state banks' purchases.
Gold (XAU/USD) Daily Chart
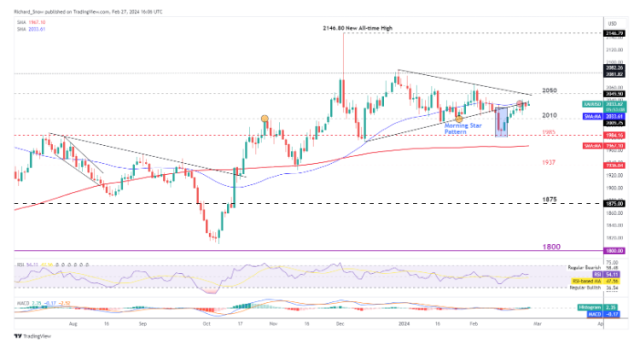
Source: TradingView
Gold prices have kept trying to break through and have been following a previous trendline that was supported but is now acting as resistance. For now, the 50-day simple moving average is stopping its rise. As a result of falling US dollar and Treasury bond yields, the price of gold is navigating a complex landscape. It continues to decline slowly, but there is a chance that it will rise again and reach its two-week high of $2,041.
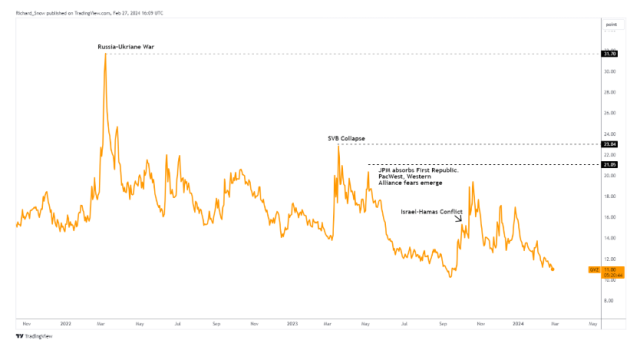
Implied 30-Day Gold Volatility Index (GVZ)
In recent trading sessions, gold prices have been testing important levels of support and resistance. Traders are keeping a close eye on the possibility of a bullish rise. At the moment, the market is cautious and is keeping a close eye on future US economic data releases, which could show the direction of Federal Reserve policy. Even though some Fed officials have said things that sound like they want to delay rate cuts, gold prices have found support. This shows that traders are ready to take advantage of changes in what they think will happen with monetary policy.
Gold Price Technical Analysis: Four-Hour Chart
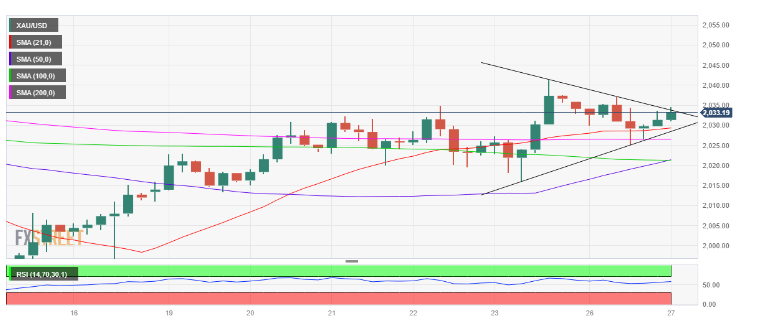
The Relative Strength Index (RSI) shows that prices are increasing, and the four-hour chart hints at a pennant-shaped breakout. There is even more optimism because people are looking forward to a Bull Cross, meaning the 50-SMA might go above the 100-SMA.
Gold prices are close to hitting support at $2,034, and a clear break above it could lead to a test of recent highs and a challenge of the psychological barrier at $2,050. On the other hand, if this progress isn't maintained, prices could fall back to areas where they are most needed, with $2,016 being a key support level for gold buyers.
Market Outlook
According to the markets, gold is a cautiously optimistic asset. According to the forecasts for Fed policy, gold’s price is closely linked to US economic indicators, and underlying demand factors. Traders are still on the lookout and are ready to change their plans if the economy changes or if they see signs that gold is about to make its next big move.
In a way, gold's market performance is like a dance with doubt; it gracefully moves between being strong and being weak. As we move through these uncertain times, gold remains a source of security for many. For buyers, it's not just about making money right away; they also need to know what's driving the price of gold. Gold stays strong despite the complex changes in economics, as it is a timeless object in a world, where money is always changing hands.