S&P 500 and Nasdaq: Bullish Signals, Yet Resistance Looms
By Daniel M.
January 5, 2025 • Fact checked by Dumb Little Man

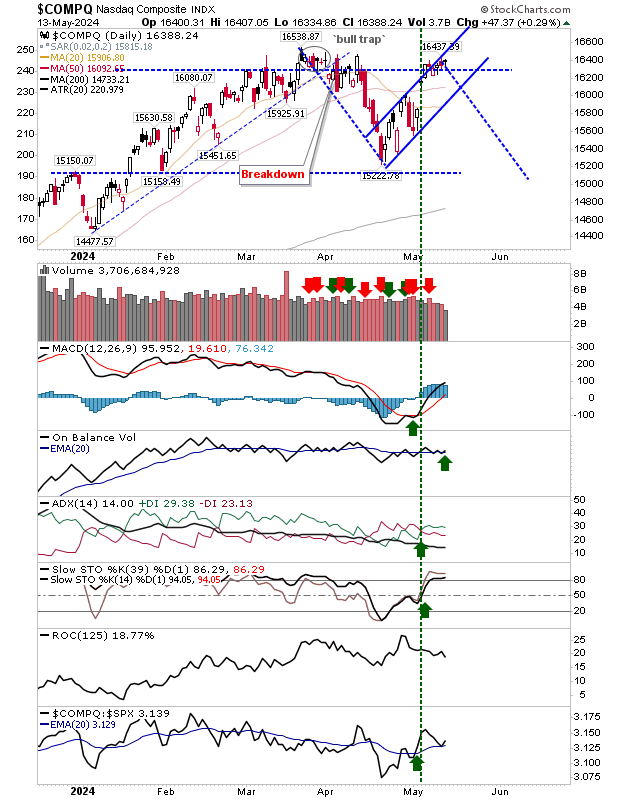
Recent highs continue to act as resistance, while yesterday's losses didn't breach the lows set on Friday, keeping the markets in a tentative balance. The Nasdaq has reactivated a ‘buy' signal on the On-Balance-Volume indicator, maintaining a delicate balance that could swing either way.

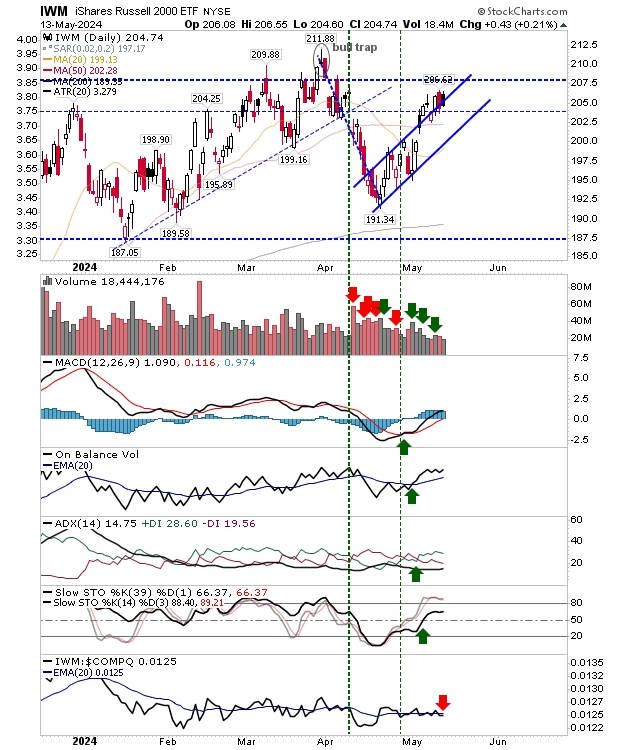
The Russell 2000 is struggling against the upper resistance of a bearish flag pattern. Today's dark candlestick compounds the bearish sentiment from Friday, potentially pushing it back into the flag pattern and setting it up for a possible decline to support levels. However, overall technicals are still net bullish.

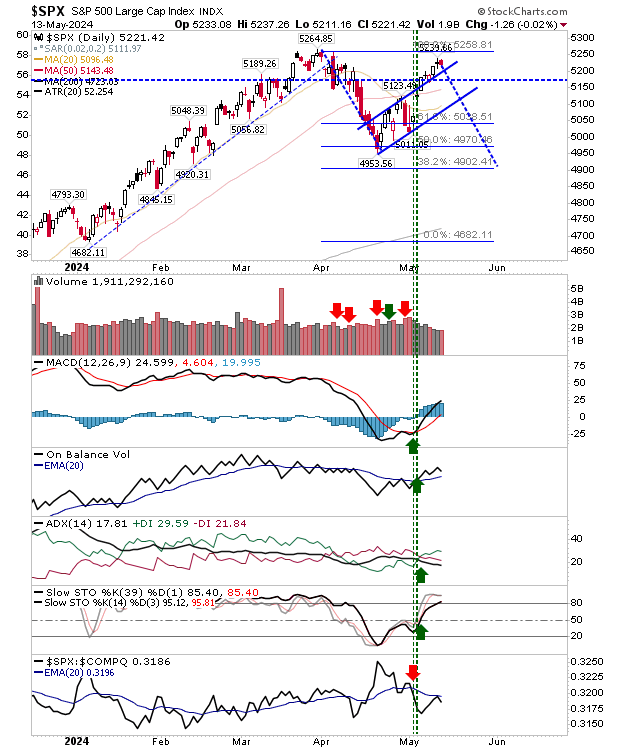
The S&P 500 is similarly testing the waters around its 52-week high, with today’s modest selling volume adding a layer of caution despite an overall bullish technical outlook.

The market’s recent bearish days follow a rally from an oversold and vulnerable state, skipping the risk of a zig-zag correction and hinting at a potential stabilization in a sideways consolidation. The lack of trading volume suggests the market could be susceptible to any significant volume movements, indicating a cautious approach is warranted as exhaustion sets in.
Daniel M.
Daniel Moore is a seasoned trading analyst with over 20 years of experience navigating the ever-evolving financial landscape. Renowned for his unconventional yet effective approach, Daniel utilizes a blend of technical and fundamental analysis to identify hidden gems and craft winning trade strategies. He is a master at demystifying complex market data and translating it into actionable insights for traders of all experience levels.


