
A Fresh Look at Nasdaq 100's Path Since Our Last Update
Since our last discussion on the Nasdaq 100 (NDX) in mid-February, our analysis has closely followed the development predicted by the Elliott Wave Principle (EWP), specifically the “green W-5” wave.
Initially, the rally from the low in October 2023 presented a complex pattern, with a notable five-day drop leading into January 5.
Our previous assessment suggested a temporary retreat to around NDX 17100+/-100 and NAS 15250+/-100 for a “green W-4,” followed by a surge to complete the “green W-5” wave.
As of our last commentary, the NDX was trading at approximately $17,600. Fast forward five weeks, and it now trades around $18,420, marking a 4.7% increase.
This highlights the importance of frequent market analysis. Our revised outlook sees the NDX approaching the final stages of a “grey W-v,” concluding the “green W-5” wave around $18,700+/-100, characterized by an ending diagonal (ED) pattern.
Figure 1. NDX Hourly Chart with Detailed EWP Count and Technical Indicators
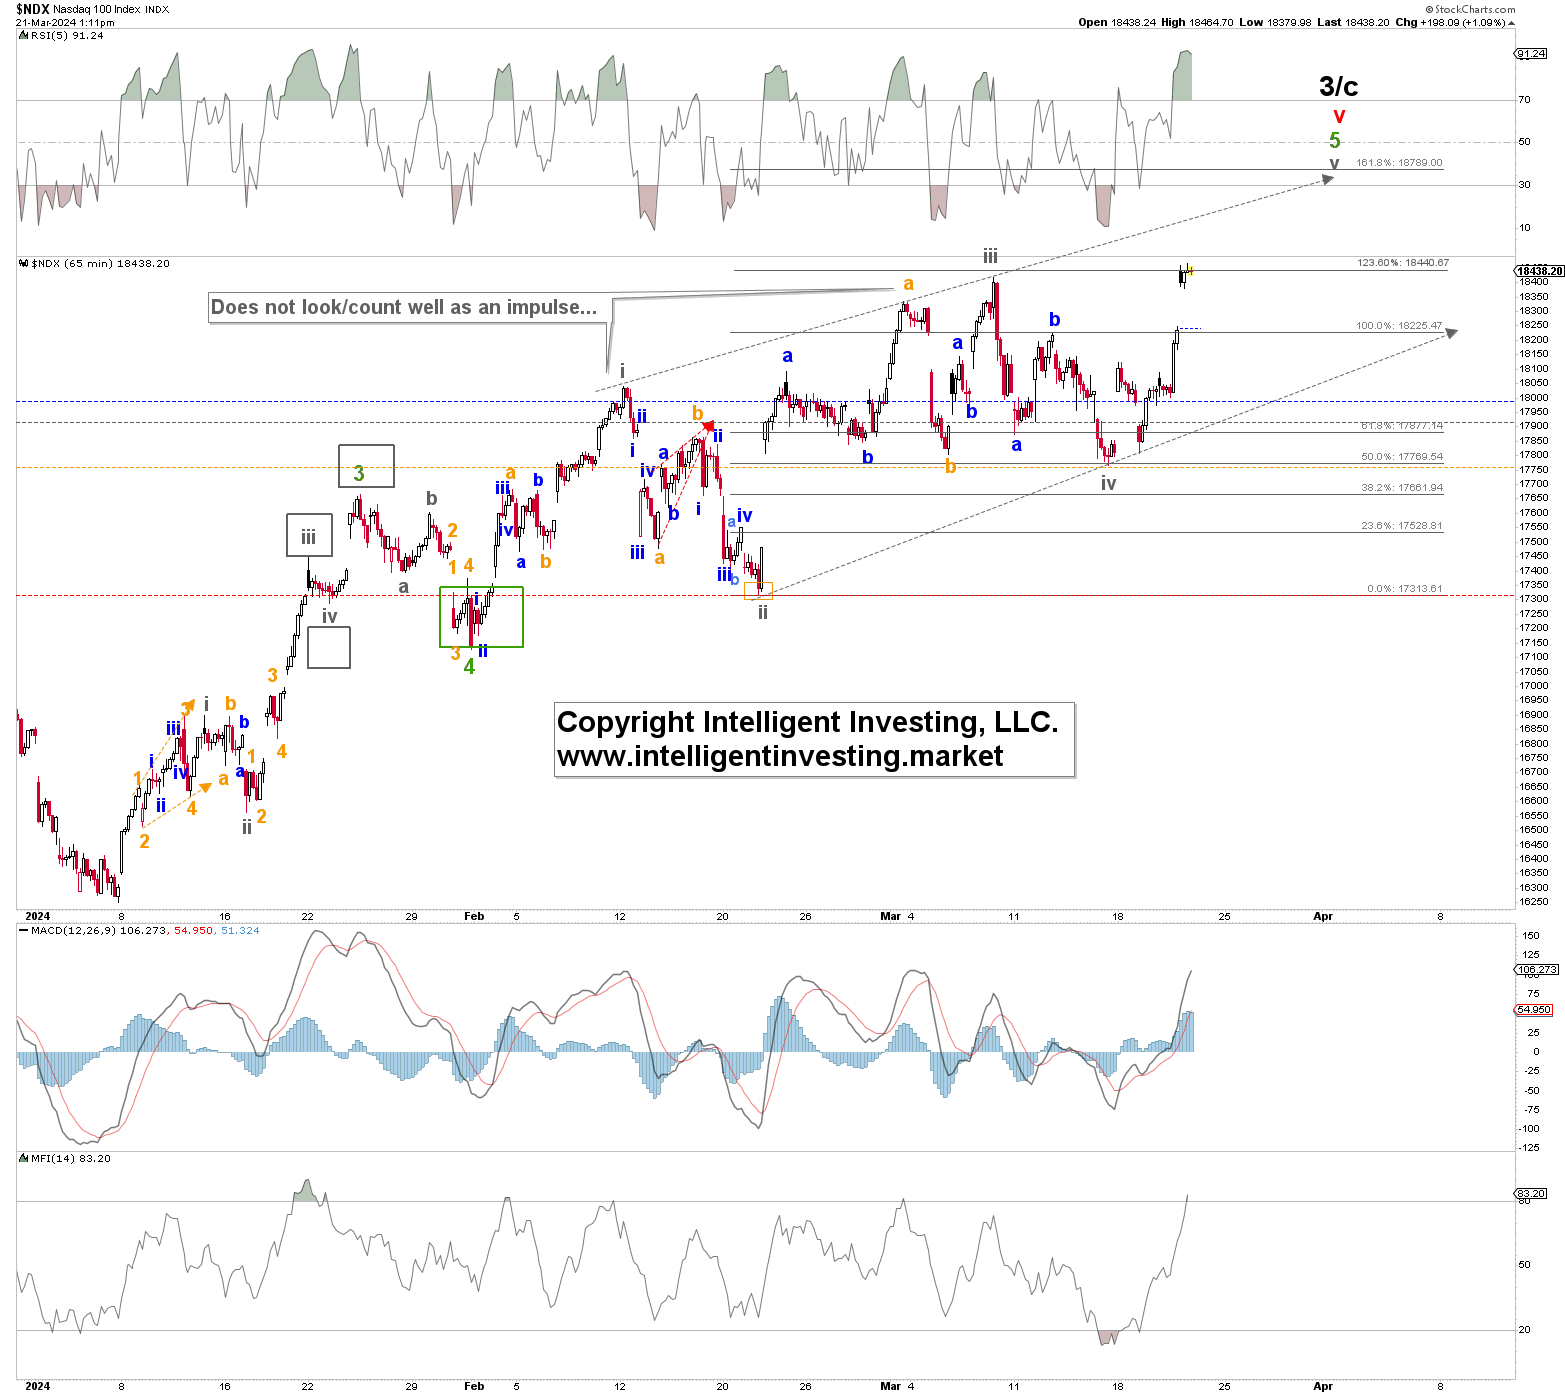
Ending diagonals typically display a 3-3-3-3-3 wave structure, indicating the culmination of a trend. Notably, in such patterns, the first and fourth waves may overlap, creating a wedge shape.
Our analysis of wave extensions and overlaps suggests that the NDX's movement adheres to the characteristics of an ending diagonal.
Figure 2. Daily NDX Chart with Detailed EWP Count and Technical Indicators
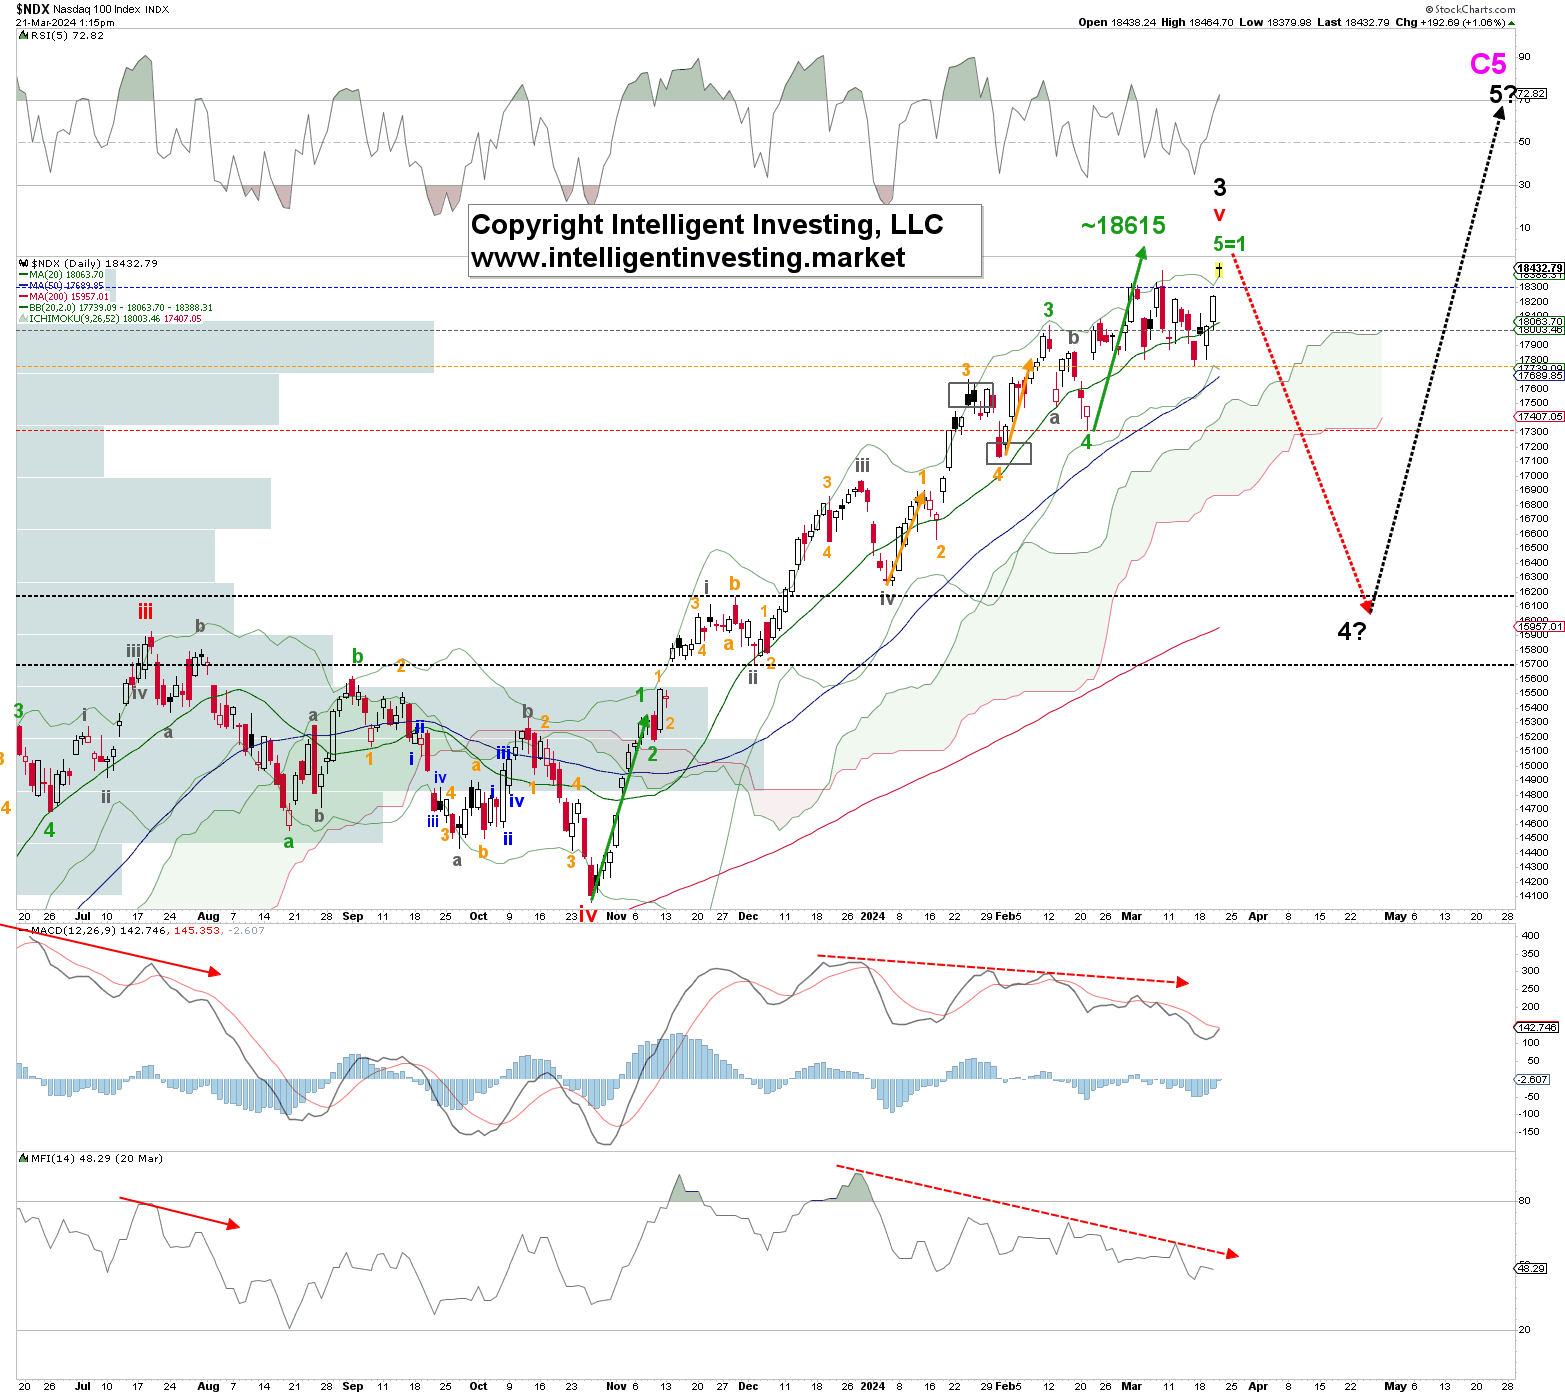
The daily chart analysis aligns the typical W-5 = W-1 relationship with a target close to $18,615, nearing the $18,800 Fibonacci level. The chart also indicates potential for a slight extension beyond this range.
To monitor the uptrend's sustainability, we've identified critical warning levels: the first warning at $18,300, followed by subsequent thresholds. A fall below the green W-4 low signals a shift to a “black W-4?” phase, targeting around NDX 15900+/-200. Crucially, a breach below the October 2023 low would signify the end of the bull market.